Download
1 / 22
220 likes | 317 Vues
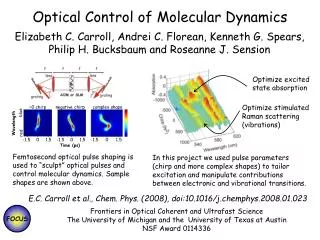
Explore the innovative use of molecular photovoltaics to activate neural cells through artificial retinas and PSI on heterostructures. Learn about reconstitution steps, spectral properties, and spatial distribution of electric potential. Kinetic experiments reveal Ca2+ increase. Presented at Oak Ridge in 2009.

E N D
Molecular Photovoltaics and the Optical Activation of Neural Cells E. Greenbaum1, M. S. Humayun2, B. R. Evans1, T. Kuritz1, I. Lee3, C. P. Pennisi4 1Oak Ridge National Laboratory, 2University of Southern California, 3University of Tennessee, 4Aalborg University March 18-19, 2009 Oak Ridge, Tennessee Presentation_name
PSI PSI H H H H H H H H H H H O O O O O O O O O O O S S S S S S S S S S S Au PSI on a Heterostructure
d c h Light 0 V – – – + + + b a 0 nm Au Measurement of Electrostatic Potential in Nanometer-Resolution: Schematic Illustration Kelvin Probe Method in Lift Mode
30 nm 5 V a b Light on Light on 0 V 15 nm -5 V 0 nm Light Off Light Off AFM and KFM Images of PS I Reaction Centers Immobilized on Gold
PS I Photovoltage Topography: Summary of Three Types of Measurements The vertical arrows in above figure indicate three selected voltage points we used in this table: the two extremities and the center.
Add (proteo) liposomes Load with the fura-3 dye WERI-RbI retinoblastoma cells fused with (proteo)liposomes Illuminate with 600-700 nm WERI-RbI retinoblastoma cells fused with (proteo)liposomes and loaded with fura-3 WERI-RbI retinoblastoma cells
RECONSTITUTION FIRST STEP: PSI RECONSTITUTION INTO PROTEOLIPOSOMES
Light triggers increase in cytosolic Ca2+ in proteoliposome-treated cells
Kinetic Time Course Experiments in the Presence and Absence of PSI and External Calcium
Spatial Distribution of the Electric Potential From Photosystem I Reaction Centers in Lipid Vesicles
Distribution of the Electric Potential Close to a PSI Reaction Center Inserted in the Vesicle Membrane The Role of Ionic Strength 0 0.1 M IEEE Transactions on Nanobioscience, Vol. 7, No. 2, June 2008, Pennisi, Greenbaum & Yoshida