Download
1 / 13
140 likes | 319 Vues
Tests of Significance. Section 10.2. Tests of Significance. Used to assess the evidence in favor of some claim.

E N D
Tests of Significance Section 10.2
Tests of Significance • Used to assess the evidence in favor of some claim. • Example: Test sweetener in cola to see if it loses its sweetness over time. Positive # means loss of sweetness. Results of ten tasters: 2.0, 0.4, 0.7, 2.0, -0.4, 2.2, -1.3, 1.2, 1.1, 2.3 • X = 1.02. Is this really loss of sweetness or just chance variation? • Suppose we know that σ = 1.
Sweetness Loss At x = 1.02 the p-value is .0006.
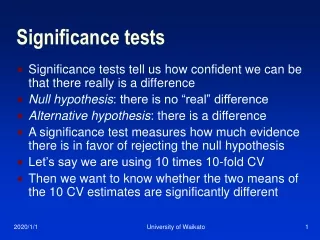
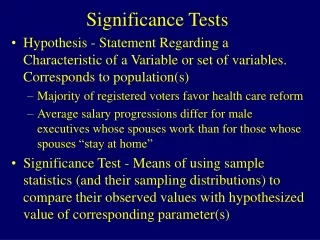
Steps in Test of Significance (HATS) • H-Hypotheses: State assumption, null hypothesis, H0, State what we suspect, the alternative hypothesis, Ha. • A-Assumptions: Check that a test can be conducted and what type of test should be used. • T-Test: Calculate Test Statistic (sample statistic used to estimate a population parameter) and see how likely it could happen by chance (P-value is probability). • S-Summarize: results with small p-values (< .05) rarely occur if null hypothesis were true – statistically significant.
To Compute P-value Ex: To find P(x ≥ sample mean), • Find standard deviation of sampling distribution. • Draw a picture. • Standardize x to find P(Z ≥ z), P-value.
To compute the z Test Statistic z = (x - µ0) / (σ/√n) • If H0: µ = µ0 • Ha: µ > µ0 find P(Z ≥ z) • Ha: µ < µ0 find P(Z ≤ z) • Ha: µ ≠ µ0 find P(Z ≤ z) or P(Z ≥ z) • Draw each situation.
Example: • Mean systolic blood pressure for males is reported to be 128 with a st. dev. of 15. A sample of 72 executives have a mean of 126.07. Is this evidence that the executives have a different mean blood pressure from the general public? • H H0: µ = 128; Ha: µ ≠ 128 Draw!!! • A Assumptions? • T Test Statistic Z and P-value • S Summarize Results
Executives Example • Test Statistic and P-value • Summary: 27% of the time a sample would differ from the population in this way. This is not good evidence that the executives differ from others.
Significance Level • Sometimes we have a predetermined value of p, written as α, alpha. • If the p-value is as small as, or smaller than, α, then we say “The data are statistically significant at level α.” • If Z ≥ z* then reject null hypothesis. • Never accept null hypothesis. Reject or fail to reject.
Example: Test with given α • Concentration of active ingredient is reported to be .86 with a st. dev. of .0068. A sample of 3 measurements have a mean of .8404. Is there significant evidence at the 1% level that µ ≠ .86? • H H0: µ = .86; H0: µ ≠ .86 Draw!!! • A Assumptions? • T Test Statistic Z (Use table C to compare to 99% z*) • S Summarize Results
Example • Test Statistic z • Summary: z was much larger than z* so we reject the hypothesis that the concentration is .86.
Significance Tests Steps (HATS): • H: ID Population and parameter of interest. State null and alternative hypothesis. • A: Choose appropriate inference procedure. Verify assumptions for using procedure. • T: Carry out Inference Test: • Make a sketch! • Calculate test statistic. • Find P-value. • S: Interpret results and summarize in the context of the problem.