Download
1 / 21
210 likes | 242 Vues
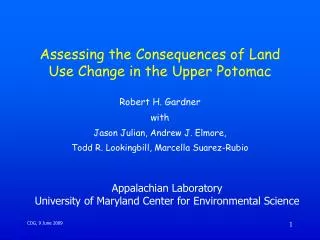
Explore consequences of land use change in Hudson River region, combining economic, environmental, and social factors. Study current scenarios and future projections using data analysis and socio-economic models.

E N D
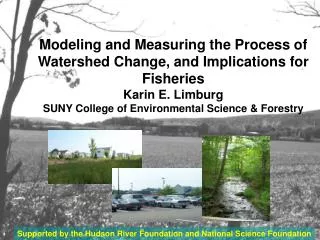
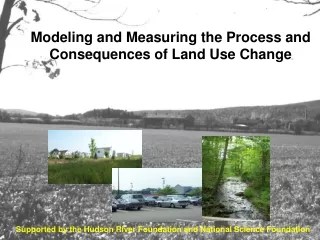
Modeling and Measuring the Process and Consequences of Land Use Change Supported by the Hudson River Foundation and National Science Foundation
Modeling and Measuring the Process andConsequences of Land Use ChangeJon Erickson, Caroline HermansUniversity of VermontKarin Limburg, Karen Stainbrook, Bongghi HongSUNY College of Environmental Science and ForestryJohn Gowdy, Audra Nowosielski, John PolimeniRensselaer Polytechnic InstituteKatherine DanielsNew York Planning FederationDavid BurnsDutchess County Environmental Management CouncilEileen SassmanWappinger Creek Watershed Intermunicipal Council
FEEDBACK LOOPS (marginal, and potentially episodic) Chlorides Incremental Economic Change Incremental Land-Use Change Incremental Watershed Health Decline OUTSIDE WORLD The Tyranny of Small Decisions School Quality Traffic Congestion Energy Dependence Social Networks Community Services
FEEDBACK LOOPS Biophysical $ Watershed Health Economic Structure and Change Land-Use and Demographic Change PARTICIPATORY PLANNING for BIO-REGIONAL POLICY OUTSIDE WORLD Out from Under the Tyranny Land Use Society Community Economy Business Households
Biophysical Land Use Society Community Economy Business HouseH Individuals Economic Structure and Change Land-Use and Demographic Change Watershed Health from Models to Mayhem
HOUSEHOLDS GOVERMENT Public Services Private Goods & Services Consumption Goods Labor INDUSTRY Exports Depreciation OUTSIDE WORLD Imports Investment CAPITAL ECONOMIC CHANGE • County-Wide Workshop: • 1. Semi-Conductor Industry • Suburbanization • Transformation of • Agriculture • 4. Commuting
LAND USE AND DEMOGRAPHIC CHANGE • Past Change • Satellite maps • Ortho photos • Land use interpret. • Tax parcels • Building permits
Ortho Photo Area of Detail: LaGrange Poughkeepsie border
VACANT PARCELS Census by Block, Tract, Town, Zip . . . LAND USE AND DEMOGRAPHIC CHANGE • Future Change • Census Variables: Population • and Income growth • Tax Parcel Variables: Use Code, • Assessed Value, Acreage • Spatial Variables: Distance to • Central Business District • Biophysical Constraints • Slope, Soils, Wetlands • Social Constraints • Zoning • Ag. land management • Riparian management • Housing preferences
Household Income Housing Demand $ Social Constraints Residential Development Land Use Interpretation Economic Scenario
CURRENT SCENARIO Impervious Surface Estimates