Download
1 / 33
330 likes | 456 Vues
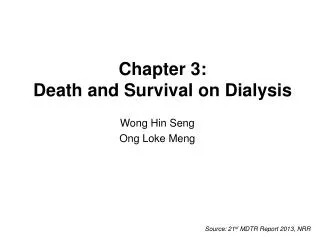
Chapter 3: Death and Survival on Dialysis. Wong Hin Seng Ong Loke Meng. Source: 21 st MDTR Report 2013, NRR. Table 3.1.1: Deaths on dialysis 2004-2013. Source: 21 st MDTR Report 2013, NRR. Figure 3.1.1: Death rates on dialysis 2004-2013. Annual death rate on PD. Annual death rate on HD.

E N D
Chapter 3:Death and Survival on Dialysis Wong Hin Seng Ong Loke Meng Source: 21st MDTR Report 2013, NRR
Table 3.1.1: Deaths on dialysis 2004-2013 Source: 21st MDTR Report 2013, NRR
Figure 3.1.1: Death rates on dialysis 2004-2013 Annual death rate on PD Annual death rate on HD 20 15 Death rate 10 5 0 '04 '05 '06 '07 '08 '09 '10 '11 '12 Year Source: 21st MDTR Report 2013, NRR
Table 3.1.2: Causes of death on dialysis 2004-2013 Source: 21st MDTR Report 2013, NRR
Table 3.2.1(a): Patient survival by dialysis modality analysis (censored for change of modality) Source: 21st MDTR Report 2013, NRR
Figure 3.2.1(a): Patient survival by dialysis modality analysis (censored for change of modality) Kaplan-Meier survival estimates, by Modality 1.00 0.75 Cumulative survival 0.50 HD 0.25 PD 0.00 0 12 24 36 48 60 72 84 96 108 120 Duration in months Source: 21st MDTR Report 2013, NRR
Table 3.2.1(b): Patient survival by dialysis modality analysis (not censored for change of modality) Source: 21st MDTR Report 2013, NRR
Figure 3.2.1(b): Patient survival by dialysis modality analysis (not censored for change of modality) Kaplan-Meier survival estimates, by Modality 1.00 0.75 Cumulative survival 0.50 HD PD 0.25 0.00 0 12 24 36 48 60 72 84 96 108 120 Duration in months Source: 21st MDTR Report 2013, NRR
Table 3.2.2: Unadjusted patient survival by year of entry, 2004-2013 Source: 21st MDTR Report 2013, NRR
Figure 3.2.2: Unadjusted patient survival by year of entry, 2004-2013 Kaplan-Meier survival estimates, by yrcom 1.00 Yr 2013 Yr 2012 0.75 Yr 2011 Yr 2010 Yr 2009 Yr 2008 Cumulative survival 0.50 Yr 2007 Yr 2006 Yr 2004 Yr 2005 0.25 0.00 0 12 24 36 48 60 72 84 96 108 120 Duration in months Source: 21st MDTR Report 2013, NRR
Table 3.2.3: Unadjusted patient survival by age, 2004-2013 Source: 21st MDTR Report 2013, NRR
Figure 3.2.3: Unadjusted patient survival by age, 2004-2013 Source: 21st MDTR Report 2013, NRR
Table 3.2.4: Unadjusted patient survival by diabetes mellitus status, 2004-2013 Source: 21st MDTR Report 2013, NRR
Figure 3.2.4: Unadjusted patient survival by diabetes mellitus status, 2004-2013 Kaplan-Meier survival estimates, by Diabetes 1.00 0.75 Cumulative survival 0.50 Non-diabetic 0.25 Diabetic 0.00 0 24 48 72 96 120 144 168 Duration in months Source: 21st MDTR Report 2013, NRR
Figure 3.3.1(a): Variation in patient survival at 1-year among HD centres adjusted for age and diabetes mellitus status, 2008-2012 % HD survival at 1-year: 2004-2012 cohort (lower 95% CI, upper 95% CI) 100 94.1 80 60 % survival 40 20 0 0 50 100 150 200 250 300 350 400 450 500 550 600 650 Centre *Horizontal line represents the median % survival among HD centres Source: 21st MDTR Report 2013, NRR
Figure 3.3.1(b): Funnel plot at 1-year among HD centres adjusted for age and diabetes mellitus status, 2008-2012 cohort 100 80 60 % survival 40 20 0 0 50 100 150 200 250 300 350 400 450 500 550 Number of HD Patients Percentage survival 2 SD from mean 3 SD from mean *Horizontal line represents the median % survival among HD centres Source: 21st MDTR Report 2013, NRR
Figure 3.3.1(c): Variation in patient survival at 5-years among HD centres adjusted for age and diabetes mellitus status, 2004-2008 % HD survival at 5-year: 2002-2006 cohort (lower 95% CI, upper 95% CI) 100 80 67.3 60 % survival 40 20 0 0 40 80 120 160 200 240 280 320 360 400 440 Centre *Horizontal line represents the median % survival among HD centres Source: 21st MDTR Report 2013, NRR
Figure 3.3.1(d): Funnel plot for patient survival at 5-years among HD centres adjusted age and diabetes mellitus, 2004-2008 cohort 100 80 60 % survival 40 20 0 0 50 100 150 200 250 Number of HD Patients Percentage survival 2 SD from mean 3 SD from mean *Horizontal line represents the median % survival among HD centres Source: 21st MDTR Report 2013, NRR
Figure 3.3.2(a): Variation in patient survival at 1-year among PD centres adjusted for age and diabetes mellitus, 2008-2012 % PD survival at 1-year: 2004-2012 cohort (lower 95% CI, upper 95% CI) 100 89.8 80 60 % survival 40 20 0 0 2 4 6 8 10 14 16 18 20 22 24 12 Centre *Horizontal line represents the median % survival among PD centres Source: 21st MDTR Report 2013, NRR
Figure 3.3.2(b): Funnel plot at 1-year among PD centres adjusted for age and diabetes mellitus status, 2008-2012 cohort 100 80 60 % survival 40 20 0 0 100 200 300 400 500 600 700 Number of PD Patients Percentage survival 2 SD from mean 3 SD from mean *Horizontal line represents mean of % survival among PD centres Source: 21st MDTR Report 2013, NRR
Figure 3.3.2(c): Variation in patient survival at 5-years among PD centres adjusted for age and diabetes mellitus, 2004-2008 % PD survival at 5-year: 2002-2006 cohort (lower 95% CI, upper 95% CI) 100 80 60 % survival 45 40 20 0 0 2 4 6 8 10 12 14 16 18 20 Centre *Horizontal line represents the median % survival among PD centres Source: 21st MDTR Report 2013, NRR
Figure 3.3.2(d): Funnel plot for patient survival at 5-years among HD centres adjusted age and diabetes mellitus, 2004-2008 cohort 100 80 60 % survival 40 20 0 0 50 100 150 200 250 Number of PD Patients Percentage survival 2 SD from mean 3 SD from mean *Horizontal line represents mean of % survival among PD centres Source: 21st MDTR Report 2013, NRR
Table 3.4.1: Adjusted hazard ratio for mortality of dialysis patients uncensored for change of modality (2004-2013) Source: 21st MDTR Report 2013, NRR
Figure 3.4.1(a): Adjusted hazard ratio for mortality of dialysis patients uncensored for change of modality by diastolic blood pressure (2004-2013 cohort) Diastolic Blood Pressure (mmHg) 1.6 1.5 1.06 1.03 1 1 .86 Hazard ratio .5 0 <70 70-<80 80-<90(ref*) 90-<100 >=100 Source: 21st MDTR Report 2013, NRR
Figure 3.4.1(b): Adjusted hazard ratio for mortality of dialysis patients uncensored for change of modality by serum phosphate (2004-2013 cohort) Serum Phosphate (mmol/L) 2 1.86 1.5 Hazard ratio 1 1 .93 .92 .87 .5 0 <0.8 0.8-1.3(ref*) 1.3-1.8 1.8-2.2 >=2.2 Source: 21st MDTR Report 2013, NRR
Figure 3.4.1(c): Adjusted hazard ratio for mortality of dialysis patients uncensored for change of modality by hemoglobin (2004-2013 cohort) Hemoglobin (g/dL) 2 1.77 1.5 Hazard ratio 1 1 .83 .5 0 <10 10-12(ref*) >=12 Source: 21st MDTR Report 2013, NRR
Table 3.4.2: Adjusted hazard ratio for mortality of HD patients uncensored for change of modality (2004-2013 cohort) Source: 21st MDTR Report 2013, NRR
Figure 3.4.2: Adjusted hazard ratio for mortality of HD patients uncensored for change of modality by Kt/V (2004-2013 cohort) KT/V-HD 1.46 1.5 1.23 1.14 1.08 1 1 Hazard ratio .5 0 <1 1-<1.2 1.2-<1.4(ref*) 1.4-<1.6 >=1.6 Source: 21st MDTR Report 2013, NRR
Table 3.4.3: Adjusted hazard ratio for mortality of PD patients uncensored for change of modality (2004-2013 cohort) Source: 21st MDTR Report 2013, NRR
Figure 3.4.4(a): Variations in RAMR by HD centre, 2012 (lower 95% CI, Upper 95% CI) 100 90 80 70 60 50 RAMR 40 30 20 10 0 0 50 100 150 200 250 300 350 400 450 500 550 600 Centre Source: 21st MDTR Report 2013, NRR
Figure 3.4.4(b): Funnel plot of RAMR by HD centre, 2012 100 90 80 70 60 50 RAMR 40 30 20 10 0 20 50 80 110 140 170 200 230 260 290 320 350 380 Number of patients in the centre 99% Control Limit 95% Control Limit Source: 21st MDTR Report 2013, NRR
Figure 3.4.5(a): Variations in RAMR by PD centres, 2012 (lower 95% CI, Upper 95% CI) 22 20 18 16 14 12 Centre 10 8 6 4 2 0 0 5 10 15 20 25 30 35 40 45 50 55 60 RAMR Source: 21st MDTR Report 2013, NRR
Figure 3.4.5(b): Funnel plot for RAMR by PD centres, 2012 60 55 50 45 40 35 RAMR 30 25 20 15 10 5 0 0 50 100 150 200 250 300 350 400 450 500 Number of patients in the centre 99% Control Limit 95% Control Limit Source: 21st MDTR Report 2013, NRR