Download
1 / 64
650 likes | 790 Vues
Conducting Policy-Based Education Finance Research in China. The China Institute for Educational Finance Research (CIEFR). China’s first academic institution for educational finance research (Oct . 2005) An innovative joint-venture: MOF, MOE, and Peking University.

E N D
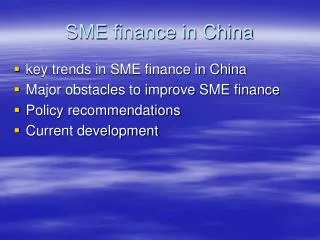
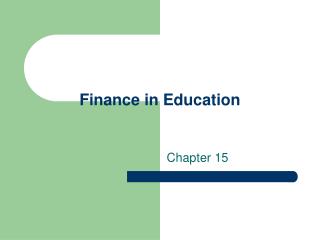
The China Institute for Educational Finance Research (CIEFR) • China’s first academic institution for educational finance research (Oct. 2005) • An innovative joint-venture: MOF, MOE, and Peking University. • Two major areas of activity: • Policy consulting • Policy-related research
Policy Consulting • Challenges: • Small windows of time • Topics change quickly • Little empirical evidence on which to base suggestions • Pressure… • Opportunities from engaging in policy consulting: • Immediately access to policymakers • Understand key concerns • Learning • Dissemination of research findings • Support for conducting research projects
Policy consulting: Process • Refer to past empirical studies in China • Utilize existing data • Our own past surveys • Other large-scale survey/census data • government statistics (public) • Review foreign country practices and policies • Short-term surveys, interviews, site visits
Policy Consulting: for the MOF/MOE Examples: • Reform of Education Finance Statistics System • Reform of the Rural Compulsory Education Guarantee Funding Mechanism • Key Policies of Increasing Funding for China’s Education During the Eleventh Five-Year Plan Period • National Plan for Medium and Long-Tem Education Reform and Development: Issues of Educational Finance • Financial Support Mechanisms for R&D at Higher Education Institutions • Budget Provision for National Universities
Policy-related research • Descriptive • using randomly sampled, representative data (2) Policy or Program Impact Evaluation • Randomized Control Trials (RCTs) • Quasi-experiments • Assessment using reliable/valid measures/outcomes (3) Action-based Research
Some Current Areas of Research (1) Vocational Education (2) Academic High School Education (3) Higher Education (4) Migrant Education (5) Early Childhood Education (6) Disabilities and Education
First…Background:Changes in the supply/demand of Human Capital in China
The size of economy in 2008 was more than 16 times that in 1978 It took the US nearly 100 years from 1870 to 1970 … to grow by 10 times!
“Iron Law of Economic Development” This is sometimes called the Kuznet’s curve Ethiopia, Rwanda, etc. Percent of Population in the Agricultural Sector US and other OECD nations Income per Capita Data from the World Bank
Development = IndustrializationModernization = Urbanization Percent of Pop’n in Ag. Sector Zero: there are no high income countries in world with more than 10% of their populations that live in agriculture 10-20% Income per Capita
“Miracle Development—with Korean Characteristics” Percent of Pop’n in Ag. Sector Korea—1950s Korea—1974 Korea—1987 Korea—today Income per Capita
China at the start of Economic Reforms • In 1980, China was: • Poor • Rural • Agricultural Percent of Pop’n in Ag. Sector China in 1980s Income per Capita
China is moving along the Transformation Path, according to the Iron Law • From left to right … INCOME • From top to down … URBANIZATION/INDUSTRIALIZATION
Shenzhen in 1980 … … and 2000
Overall Increase in Off-farm Work 63% 2008 In 2008 more than 90% of households have at least 1 family member (or son / daughter) working off the farm In 1980: only 4% worked full time off the farm
Transformation Path So it is clear that as China is growing (moving left to right across the graph), it also is beginning to move “down” the transformation path … this is “development” Percent of Pop’n in Ag. Sector Income per Capita
The movement of this labor … in vast quantities is what helps drive growth in the early stages of development …
A low unskilled wage in the 1980s/1990s is why such a large share of the things the world makes are manufactured in China today! 0.50 Japan EU Korea Australia Mexico Brazil Sri Lan. China US Hourly Wage, 1990s
This was also enabled by China’s education and health systems during the 1970 and 1980s seemed to have played an important role • Infectious diseases were controlled; infant mortality fell … • School authorities got everyone into school (at least elementary school) • to teach the rudiments of reading and arithmetic … • instill discipline to be a good worker!
Wage rises in coming years Since 2000 Unskilled wage 2007 But, the rise in wages is now happening in China … Wage have risen rapidly recently … In coming years … projected to rise even faster …
Future growth of GDP (5, 6, 7 or 8 %/year) demand for labor will increase
today Birth rates Death rates Supply of labor is falling … In 1990 ≈ 25 million babies/year / In 2010 ≈ 15 million babies/year … and falling
Summary: Implications China continues to grow: RISING DEMAND Size of labor force falls: FALLING SUPPLY Rising wages in the future Changing industrial structure By 2025 to 2030 $10-15/hour
Are rising wages bad? Of course not…“good riddance to sweat shop jobs.” But, with higher wages, China will have to move itself up the productivity ladder …
So: China’s real human capital challenge is coming … Can China become competitive in industrial sectors requiring medium and high skilled human capital? Can it maintain relative equality/equity in the process?
“Achievements” so far in Education • 1990s: universal 9-year compulsory education • Late 1990s: higher education expansion • GER went from 5-6% in the mid-1990s to 29% in 2009 • Largest higher education system in the world • 2000s: high school expansion • GER went from 40% in late 1990s to 79% in 2009 • mandated 50:50 ratio between regular and vocational
What about Educational Quality? • Shanghai PISA Results 2009 (PISA is for up to age 15 years old) • Quality in the rest of China? • Not much is known about quality in terms of student outcomes.
CIEFR’s Research: Three Areas (1) Vocational Education and Training (2) Academic High School (3) Higher Education (financial aid)
(1) Investment in Vocational vs. General Schooling: Evaluating China’s Expansion of Vocational Education and Training (VET)
Research Questions about VET How to balance investments in vocational vs. general education to support economic growth and reduce social inequality? • What are the returns to VET? if negligible, policymakers may consider slowing the expansion or improving the quality of VET. (2) What are the factors that keep junior high school graduates in poor, rural areas from continuing with their studies? A fairly low proportion of them go on to any type of high school. (3) What is the quality and cost-effectiveness of VET programs? Few mechanisms to evaluate the quality of VET programs
(2) Supporting Disadvantaged Junior High Students • Randomized trials involving junior high students in poor areas: • Vouchers high school (academic or VET) • Edu/career counselling (returns to school, career awareness) • Outcomes: • Persistence/dropout in junior high school • Academic (exam) performance • High school matriculation rates • Baseline and Follow-up Surveys: • 2 provinces • 132 rural public junior hi schools, 473 classes • 19,832 seventh-grade students
132junior high schools first year students (~20000) 4 poor students X 473 classes = 1892 students Vouchers ($$$) + LONG OR SHORT Counseling Interventions Long : 22JHSs Short+$$$:22JHSs Control: 22JHSs, 308poor stus Long+$$$: 22JHSs $$$: 22JHSs Short:22JHSs 41classes: no training 35 classes: long training 43 classes: no training 79 classes 36 classes: short training 40classes: long training 36 classes: no training 39 classes: no training 47 classes – no training 78of 156 poor students got $$$ 80of 160 poor students got $$$ 72of 144 poor students got $$$ 164poor students – no $$$ 140poor students—no $$$ 144poor students—no $$$ 188poor students—no $$$ 86of 172 poor students got $$$ 158of 316 poor students got $$$
Migrant JHS students in Beijing • 200+ million rural migrants in China, many adults bring their children to the urban areas • Household registration system restricts the educational options of these families/children • We conducted RCTs to examine the effect of vouchers and education savings plans on student persistence and academic performance. • Preliminary Results: Vouchers has some effect on reducing dropouts. Especially for students in poor, rural areas, less so for migrants in Beijing.
(3) Assessing VET High School Quality • Nov., 2011: baseline survey of students in computer application majors. Gave math and computer operation exams to students in ~110 VET high schools in 2 provinces. • May, 2012: math and computer exams to the same students to assess the value-added of their programs. • Collected other quality indicators from teachers, schools • Compare VET schools • Compare VET and academic HSs • After May, 2012: RCTs – training and incentives on how using data to improve student performance. • May, 2013: Post-intervention math and computer exams
General Concerns • Human capital formation • Academic high school is a sort of bottleneck in the pathway to college who gets there? implications for equality • Variation in academic high school quality may be great.
Study in one NW province in China • Sorting/Inequality in Education from High School to College • The Effects of Attending Different Academic High Schools • The Impact of Building Free, Elite High Schools For Students From Disadvantaged Areas Policymakers provided admin data for up to ten years • 6 years: HS entrance exam data for select counties • 10 years: college admissions data for all counties • HS expenditures and revenues (select schools)
(2) High School Quality • How to evaluate school quality is a difficult question. Value-added models are one common method. (We also tried regression discontinuity, but that’s another story…) Why Value-Added? • Currently, China uses college entrance exam (CEE) scores or college entry rates to judge the quality of high schools. • But these are absolute “status” indicators and not relative “growth” indicators. • Value-added scores are “growth” indicatorswhich reflect the learning that students gain from the time of entering to the time of leaving high school more realistically reflect instructional quality.
Analysis and Findings • We conducted student growth percentile SGP analysis on 50 high schools using high school entrance and college entrance exam results. Findings: • The rankings of high schools change depending on whether you use “absolute” indicators or these “value-added” indicators. • We also found that some students (poor, older, urban, non-minority, male, low scorers) tend to have lower SGP scores. • Because we can see the value-added scores for each student, we can see which students need additional support.
(3) Impact of Building Free, Elite High Schools For Students From Disadvantaged Areas • Academic High School is expensive and selective. • Policymakers used built two large, free, elite high schools (HSs) for students in disadvantaged areas. • From 2003-2010: Spent~ 150 million US dollars
LPS (established in 2003; gradually expanded to 5084 students by 2009) YC (established in 2006; gradually expanded to 6281 students by 2009)
Request for Impact Evaluation • Policymakers requested an impact evaluation. • Questions: What were effects of the policy on disadvantaged areas’ students’: • college admissions (any college, first 2 tiers, elite)* • high school entrance exam (participation, performance)**
Quasi-experimental Methods • Linear and Censored Quantile DID • Short-interrupted time series (SITS) with comparison group design • “Augmented” administrative data with Census data to account for censoring of observations
Findings • The policy positively impacts students even before they get to high school. • The policy increases the likelihood that students from disadvantaged areas can attend college and selective colleges – equalizes opportunities across the province. • Free, elite high schools are most effective when they provide opportunities to medium & medium-high scoring students (not just top students). • high internal ROR for poor counties from the initiative government investment “recovered” after a few cohorts.