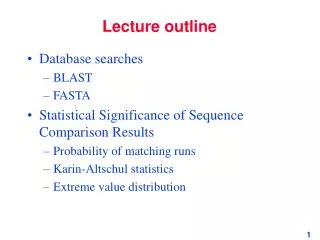
Lecture outline
This lecture explores single-cell activity of marine bacteria, including aerobic anoxygenic photoheterotrophs (AAPs) and their ecological roles. It delves into bacterivory and the selection of bacteria by nanoflagellates, as well as the importance of metabolic diversity among inactive bacterial populations. The CTC method and other molecular techniques are discussed for measuring cell respiration and identifying active bacteria. Seasonal and spatial patterns of active bacteria in relation to environmental factors, such as chlorophyll and substrate availability, are also analyzed.

Lecture outline
E N D
Presentation Transcript
Lecture outline • Single cell activity - CTC • Ecology of aerobic, anoxygenic photoheterotrophic bacteria (AAPs) • Bacterivory - do nanoflagellates select bacteria to eat? • Matching phylogeny and metabolism one cell at a time
Conceptualization • Most marine bacteria are inactive at any given time and place (refuge: “hiding out in the open”) • These bacteria form an “information database” of phylogenetic and metabolic diversity. • Substrate sources are patchy in space and intermittent in time.
Conceptualization (2) • Patches of active bacteria form in microzones of high substrate (DOC) supply. • These activity patches resupply the background of dormant bacteria. • State-of-the-art techniques now allow us to test hypotheses associated with these concepts. • Single cell activity measures • Molecular genetic techniques
The CTC Method • 5-Cyano-2,3-ditoyl Tetrazolium Chloride • CTC is reduced intracellularly in respiring cells to form an insoluble, fluorescent precipitate (formazan, CTF) • Individual active cells can be identified by microscopy or flow cytometry • Counting CTC+ cells and total cells yields “% actively respiring cells”
CTCControversy • CTC active cells are a small proportion of the total (mostly less than 10%, rarely over 30%) • CTC is toxic to cells (Ullrich et al.) • Microautoradiography shows >90% of cells take up labeled “goodies” (sugars, amino & nucleic acids) • CTC indicates respiration - not cell growth or productivity - what is “active”? • All marine bacteria tested reduce CTC in culture (Sherrs) • Detection limit for weakly active cells
CTC Detection by Flow Cytometry Total bacteria (PicoGreen) CTC+ bacteria
Cell Activity CTC • Dilution/growth experiment • % active peak at max growth rate • Mean CTF fluorescence lowest at max growth rate Sieracki et al. 1999. AEM 65:2409-2417
Seasonal CycleBoothbay Harbor Range Factors Total bact: 11 X CTC+: 160 X
October ‘01 March ‘02 Stations sampled for bacteria Wide trophic gradient R/V Cape Hattaras
CTC-Active Bacteria - 2 cruises, N=185 X- Coastal O-Sargasso CTC-active bacteria are not correlated with temperature overall, but are within systems CTC-active bacteria higher in surface waters
< 3 um Chlorophyll Whole Water Chlorophyll Active bacteria correlated with the smallest size fraction of chlorophyll (r2=0.62) Also correlated with total chlorophyll (r2=0.57)
Substrate-CTC Bioassays • 8 experiments on October cruise • Low molecular wt. substrates added for 30min, then CTC assay (60min) • Methylamine, glucose, DMS, leucine • Concentrations: 50 to 500 nM • Results shown as number of active bacteria as % of un-amended control
“New” ocean bacterial photo-metabolisms Karl 2002 Nature 415:591
“New” ocean bacterial photo-metabolisms AAPs Karl 2002 Nature 415:591
Aerobic Anoxygenic Phototrophs BacChl - IR DAPI - UV Georges Bank Sargasso Sea Sieracki ME, et al. (2006) Distribution of planktonic aerobic anoxygenic photoheterotrophic bacteria in the northwest Atlantic. Limnol Oceanogr 51:38-46
Diverse AAP Morphologies Rods and cocci Vibrios Spirilla
Size Spectra Total bacteria AAPs are larger than the average marine bacteria AAPs
Het. Bact. AAPs Synecho. Prochlor. P. Euks Sargasso Sea October Vertical Profile Microbial Community
Coastal October AAPs /mL Sargasso March 0 0.5 1 1.5 2 2.5 3 Chlorophyll (µg/L) 0 5 10 15 20 25 30 Temperature (degC) Relationships Between AAPs, Chlorophyll, and Temperature
Summary of our AAP results • AAPs are larger (more biomass per cell) than the average bacteria • AAPs have diverse morphologies, especially in the open ocean • AAPs are more abundant in productive, coastal waters than in the open ocean - they correlate with primary producers • AAPs are a higher percentage of the total bacterial biomass in productive, coastal waters (2-12%) than in the open ocean (2-5%)
AAP Ecology … SO: AAP cell and biomass distributions do not support the hypothesis that these cells are specifically adapted to the low nutrient, open ocean environment • Analogous to mixotrophic eukaryotes • Larger AAP cells may be more active, and/or avoid grazing in open ocean
Photoheterotrophs: potential light-accelerated carbon shunt in the microbial food web
Using cell sorting to study grazer preferences for bacteria • Stain subsamples with Lysotracker and bacteria activity indicator (e.g. Syto-13) • Sort active and total bacteria • Sort heterotrophic protists • PCR using prokaryote primers • Use DNA fingerprinting (e.g. T-RFLP) to compare sorted fractions
Single-cell genomicsHigh nucleic acid single bacteria sorted
Multiple Displacement Amplification (MDA) Phi-29 polymerase - just keeps on going….
MDA -> Whole genome sequencing Hutchison CA, Venter JC (2006) Nat Biotechnol 24:657-658
Whole genome amplification of the uncultured marine bacteria
qMDA: standards and controls Stepanauskas R, Sieracki ME (2007) Matching phylogeny and metabolism in the uncultured marine bacteria; one cell at a time. PNAS 104:9052-9057
Comparison of trees Two Flavobacterium with proteorhodopsin genes. These are being whole genome sequenced by JGI. There may be a PCR bias against Flavobacteria (Kirchman, et al. 2000)
Workshop:Single Cell Alternatives to Metagenomics in Environmental Microbiology Financial support: the A.P. Sloan Foundation Location: Spruce Point Inn, Boothbay Harbor, Maine Time: 9 – 11 Sept 2007, hands-on 12-14 Sept The workshop is limited to 40 participants. The Hands-On Section is pending additional funding and is limited to 10 participants
Workshop Topics • Current environmental genomics - the context for single cell approach • Technical aspects of single cell genomics: • Separation and lysis of single cells • Single cell whole genome amplification • Sequencing and assembly of single cell genomes • Integration of single cell, isolate, and community genomic data • Science questions for the single cell genomics: • Exploring global microbial diversity • Examining ecological roles of the uncultured microorganisms • Studying microbial evolution at organismal level • Bio-prospecting and industrial applications of the uncultured microorganisms • Environmental viral genomics • OPTIONAL HANDS-ON SECTION • Fluorescence-activated cell sorting • Cell lysis, whole genome amplification, and PCR-screening • Bioinformatics