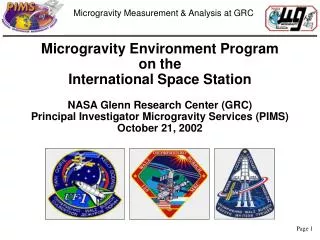
Microgravity Environment at EXPRESS Rack 1 (ER1)
100 likes | 304 Vues
Microgravity Environment at EXPRESS Rack 1 (ER1). Kevin McPherson Eric Kelly Jennifer Keller Ken Hrovat. Outline. Microgravity Environment Components SAMS/MAMS Sensor Locations Vibratory Characterization of EXPRESS Rack 1 Quasi-Steady Characterization of EXPRESS Rack 1

Microgravity Environment at EXPRESS Rack 1 (ER1)
E N D
Presentation Transcript
Microgravity Environmentat EXPRESS Rack 1 (ER1) Kevin McPherson Eric Kelly Jennifer Keller Ken Hrovat
Outline Microgravity Environment Components SAMS/MAMS Sensor Locations Vibratory Characterization of EXPRESS Rack 1 Quasi-Steady Characterization of EXPRESS Rack 1 Roadmaps for the Microgravity Environment Brief Characterization of Some Disturbances Some Things to Consider
SAMS More Localized with Increasing Frequency MAMS Global (rigid body) Microgravity Environment Components a generic label not intended to quantitatively characterize platform
Sensor Locations on the ISS SAMS SE F02, MSG upper left seat track SE F03, ER2 lower Z panel SE F04, ER1 lower Z panel SE F05, ER4 drawer 2 SE F08, ER3 seat track TSH-ES05, CIR TSH-ES06, FIR ----------------------------------------------- MAMS in ER1(OSS and HiRAP)
Vibratory Characterization of EXPRESS Rack 1 • Comparison of GMT 06-Jun-2013 to 07-Jun-2013 (f < 200 Hz): • Each plot on the left is spectral summary for that day. • The black-shapedannotations highlight the portion of acceleration spectrumwhere you will see most significant changes (~90-105 Hz) for ER1. • To see this in more detail, view the following link (a 30-page PDF) in flipbook fashion and focus on the frequency range from about 90 Hz to about 105 Hz: • http://pims.grc.nasa.gov/plots/user/etchells/2013_06_30_121f04_pcss_roadmaps500.pdf • For lower frequency concerns, where the changes are much more subtle, see analogous summary at this link: • http://pims.grc.nasa.gov/plots/user/etchells/2013_06_30_121f04one_pcss_roadmaps142.pdf Power Spectral Density Frequency (Hz)
Quasi-Steady Characterization of EXPRESS Rack 1 • MAMS Quasi-Steady Measurements for June 2013: • X-, Y-, and Z-axis components of quasi-steady (below 0.01 Hz) acceleration vector vs. time for the entire month. • The red, mean valuesshow mean values derived from ISS rates/angles data for the month: • X = 0.006 ug, Y = -0.141 ug, Z = -0.180 ug • To see this in more detail, view the link below (a 1-page PDF): • http://pims.grc.nasa.gov/plots/user/etchells/2013_06_one_month_ossbtmf_radgse_map2er1.pdf
Web-Based “Roadmap” Resources • ARCHIVE (lags real-time by 2 days): • See roadmap spectrograms for SAMS ER1 Sensor (121f04) at: http://pims.grc.nasa.gov/roadmap • Navigate PIMS roadmaps with calendar view for last ~12 years! • BUFFER (most recent 48 hours): • Roadmap Spectrograms for SAMS JEM Sensor (121f05) at: http://pims.grc.nasa.gov/plots/user/buffer • Browse most recent 2 days of screenshots from real-time. • REAL-TIME (most recent ~2 hours): • Roadmap Spectrogram for SAMS JEM Sensor is updated at: http://pims.grc.nasa.gov/html/121_f04/PIMS_ISS_color.html • This automatically refreshes in browser. • Consider the following timeline:
Some Things to Consider Spatial: EXPRESS Rack 1! Temporal: scheduling (crew sleep vs. wake)? Spectral: any resonances or sensitivities? Backup slides: misc info on microgravity environment at: http://pims.grc.nasa.gov/plots/user/etchells/backup_slides.pptx