Download
1 / 30
300 likes | 325 Vues
This update provides information on the 2003/2004 Global Competitiveness Programme (GCP) and its impact on sustainable competitiveness. It includes rankings, advantages, and disadvantages of South Africa's tourism industry.

E N D
Update on the Tourism Global Competitiveness Programme (GCP) 14 September 2010
The original 2003 / 2004 Global Competitiveness Programme (GCP) was part of a larger initiative to forge and manage strategic alignment across the sector Sustainable competitiveness is not an accident - it is created through the deliberate development of the context within which firms compete Global Competitors SAT, the formerDEAT and the dti launched the first Global Competitiveness Study focusing on understanding the challenges to deliver on the marketing promise on a sustainable long term basis Global Demand Domestic Demand Consumer Goals Strategic Context Supporting Industries National Goals Competing Product Owners Competing Operators
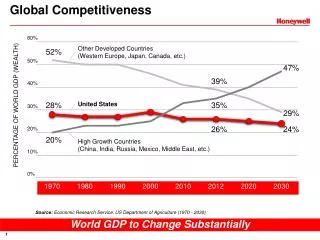
The World Economic Forum has ranked South Africa 8th out of 40 countries regionally and 61st out of 133 countries globally during 2009. However we expect the rankings to improve due to the successful hosting of the 2010 FIFA World Cup • Travel & Tourism Competitiveness Index: SA (out of 133) • 2009 Index 61 • 2008 Index 60 • T&T regulatory framework 82 • Policy rules and regulations. 36 • Environmental sustainability 44 • Safety and security 128 • Health and hygiene 94 • Prioritization of Travel & Tourism 60 • T&T business environment and infrastructure 52 • Air transport infrastructure 43 • Ground transport infrastructure 64 • Tourism infrastructure 46 • ICT infrastructure 80 • Price competitiveness in the T&T industry 38 • T&T human, cultural, and natural resources 49 • Human resources . 112 • Education and training 48 • Availability of qualified labor 131 • Affinity for Travel & Tourism 43 • Natural resources 22 • Cultural resources. 45 Source: Travel & Tourism Competitiveness Report 2009 (World Economic Forum)
Some of the Competitive Advantages 28th for Visa requirements 29th for transparency of government policy making 16th for sustainability of Travel and Tourism Industry development 18th for Government prioritization of the Travel and Tourism Industry 17th for effectiveness of marketing and branding 25th for quality of air transport infrastructure 25th for availability of seat kilometers, international 30th for number of operating airlines 40th for quality of roads 37th for quality of rail infrastructure 1st for presence of major car rental companies 38th for hotel price index 15th for extent of staff training 49th for attitude of population towards foreign visitors 10th for number of World Heritage Natural Sites Out of 133 countries globally, the following are some of South Africa’s rankings globally during 2009
Some of the competitiveness Disadvantages 128th overall ranking for Safety and Security 108th for reliability of police services 126th for quality of ground transport network 131th HIV prevalence Out of 133 countries globally, the following are some of South Africa’s rankings globally during 2009
First GCP study undertaken in 2003/4 • Purpose: • To ascertain factors hindering SA’s competitiveness; • To understand the challenges to deliver on the marketing promise on a sustainable longer term basis; • Objectives: • Benchmark how SA was performing as a destination compared to other successful destinations; • Ascertain what was driving performance (Strengths and negative Weaknesses); • Develop approach to address weaknesses and capitalize on strengths; • Project Managed by NDT, the DTI and SAT • Undertaken in two phases: • Phase 1: Competitiveness of SA as a whole; • Phase 2: • Skills and Human Resources Development review ; • Product Development incl. proposed product development in rural poverty nodes; • Transformation;
First GCP study undertaken in 2003/4 (cont.) Each focus area or chapter had specific sub-elements Externalbenchmark Benchmarking performance Internal benchmark The configuration and functioning of the value system Mapping the cluster Consumer to market The Channel Market to consumer Market Access Drivers and barriers of growth in tourism in SA Airlift Capacity Car Rental Accommodation Skills and service levels Innovation & Competition Product positioning, configuration and development Product Development International desire, usage and satisfaction profiles Configuration - key markets Domestic usage and satisfaction profiles Key metrics Transformation of the SA tourism industry Drivers and barriers Current investment status Investment and implications for future investment Investment Issues
First GCP study undertaken in 2003/4 (cont.) • Outcomes: Factors hindering SA’s competitiveness include – • Market access • Air access • Skills • Public transport • Transformation • Information • Innovation, product development, investment and SMME development: • Identification of new markets and discussions around visas ongoing; • Airlift strategy; • HRD Strategy; • Discussions with DoT; • Sector codes gazetted; • One contact number/centre, VICs etc; • Investment portfolio, Implementation of Second Economy Strategy, SMME development through TEP;
Based on the prioritisation of the twenty development areas, nine areas were selected by the working team for further analysis Prioritization Matrix High 17. Greater Durban & Pietermaritzburg 10. Port Elizabeth & Surrounds 16. Drakensberg 6. Garden Route & West Sunshine Coast 12. East London & Lower Wild Coast Relative Market Potential (Volume Weighted) 18. Elephant Coast & Surrounds 29. Panorama Region 31. Dolphin Coast & Southern Zululand 13. Upper Wild Coast 14. Witteberge Mountains 28. Central Limpopo 19. Pilanesburg, Madikwe & Mafikeng 3. Whale Coast & Overberg 1b. West Kalahari 22a. Soweto 22b. Alexandra 1a. Namakwa 5. Beaufort West 9. Eastern Cape Karoo 7. East Kalahari Low 7,500 Poverty Gap (Rm) Note: Areas 12 and 13 were combined and collectively analysed as the Wild Coast Source: Statssa Census 2001, Demarcation Board, HSRC, Monitor Group analysis
The 2010 study reviewed four modules of the original GCP study for the period 2003 – 2008 in order assess progress that the industry has made over this period • To support the South African Tourism in formulating future growth strategies by studying the overall performance and levels of competitiveness of tourism in South Africa Overall Objective Desire, Usage and Satisfaction Level of Tourists Analysis of Drivers and Barriers to Growth Internal Benchmarking of Tourism sector in South Africa External Benchmarking of South Africa with Key Competitors • Compare the tourism industry in South Africa with that of five other key competitor destinations (Australia, the US, Kenya, Thailand, and Brazil) across several performance indicators and macroeconomic factors • Study the relative performance and contribution of the tourism sector vis-à-vis other major economic sectors of the country • Assess the current state of tourism in the country and analyze the key drivers and barriers to the growth of tourism sector • Analyse the various tourism products and services offered by the country and their accessibility to the tourists • Analyse the gaps in desirability, expectation, experience, and usage of various tourism products and services, for domestic and international tourists • Desktop study • Sources used in 2010 study • In addition to the sources used in previous study, the current study leverages: • Euromonitor International database • Global organizations such as World Economic Forum, UNESCO, IMF, etc. • News and articles published on various portals • Government and related bodies such as Stats SA, South African Reserve Bank, and NEDLAC
s Five competitor countries were reviewed. These countries were identified as competitors through consumer research conducted since 2001 Brazil has seen jobs grew in line with tourist arrivals, while Australia has seen jobless growth South Africa Australia USA Thailand Brazil Kenya Travel and Tourism Parameters • Tourism Contribution to GDP in USD Bn1 (2008) • Growth (03-08) • 23.5 • 13% • 104.7 • 12% • 1,388.7 • 5% • 41.3 • 14% • 99.0 • 24% • 3.2 • 16% • Tourism Employment in ‘000s (2008) • Growth (03-08) • Direct: 439 • Total: 1,042 • 4% • Direct: 499 • Total: 1,176 • 0% • Direct: 5,477 • Total: 14,488 • -1% • Direct: 1,900 • Total: 4,178 • 2% • Direct: 2,222 • Total: 5,507 • 4% • Direct: 168 • Total: 406 • 1% • Indirect Contribution to GDP in USD Bn (2008) • % contribution • Direct Contribution to GDP in USD Bn (2008) • % contribution • Tourist Arrivals in ‘000s (2008) • Growth (03-08) • 8.8 • 8% • 14.7 • 3% • 7,0872 • 9% • 62.8 • 4.4% • 41.8 • 11.2% • 5,586.0 • 3% • 709.7 • 3.5% • 58,029.8 • 7% • 678.9 • 10% • 14,243.2 • 6% • 16.6 • 15.6% • 24.7 • 6.8% • 5,156.5 • 5% • 58.2 • 2.2% • 40.8 • 5.7% • 2.0 • 4.8% • 1.2 • 10.3% • 1,363.0 • 4% Tourism has suffered in recent years due to the economic crisis, breakout of H1N1, & internal political unrest Host to 2010 FIFA World Cup, which is expected to boost foreign arrivals Current year has remained the worst year for Australian tourism since 1989, with 4.1% decline in tourist arrivals Faith tourism is emerging as a popular tourism sector in the US Host to major sports events in 2014 (FIFA World Cup) and 2016 (Olympics) Tourism industry has suffered in recent years due to political unrest • Recent Developments Note: 1Direct and Indirect contribution of tourism industry to GDP. Numbers have been validated from respective tourism websites of various countries; 2 This number is calculated after removing ‘day tourists’ from the overall number of arrivals Source: The Travel & Tourism Competitiveness Report 2009’, World Economic Forum, February 2009; ‘Managing Tourism at World Heritage Sites’, UNESCO, 2002; ‘Travel And Tourism in the US’, Euromonitor, September 09; Bangkok Post; BBC; CNN; Tourism Research Australia; WTTC; Stats SA; ‘The Impact of Tourism on the Economy of South Africa – 2007’, SAT, August 2008
Drivers of Performance DriversofPerformance TouristPerformanceParameters EconomicBenefits • During the period 2002–2008, South Africa witnessed the highest growth in spend by international visitors (in local currency) as compared to other competitors • South Africa’s travel and tourism sector witnessed a steady growth of ~3.2% in employment over the period of 2002–2008 • Employment count for the US witnessed a decline (primarily due to the global recession and reduced outbound/domestic tourism) over 2003–2008 • Other key competitor countries – Brazil, Kenya and Thailand – witnessed a positive growth in employment in the travel and tourism sector over 2003–2008 • The government of Australia spends ~1.8 times more than South Africa on travel and tourism
Tourism Performance Parameters DriversofPerformance TouristPerformanceParameters EconomicBenefits • The total number of international tourists to South Africa has witnessed a strong growth – significantly higher than many the other key competitors • South Africa has witnessed a decline in the average length of stay over 2003–2008 while in countries such as Australia, the average length of stay has grown by 3.9% • Within South Africa, air arrivals tend to stay for longer duration than land arrivals • Australia, by far, captures more nights per tourist than any other tourist destination • Overall, about three-quarters of the visits to South Africa are for leisure purposes • During the last five years South Africa has outpaced the growth of all the other competitor locations in the leisure arrivals category
Economic Benefits DriversofPerformance TouristPerformanceParameters EconomicBenefits • Amongst all the key competitors, South Africa had the highest number of tourists per direct employee, ~16 tourists per employee - i.e. South Africa creates fewer jobs per tourist arrival • Australia, which received ~11 tourists per employee, registered the highest tourism spend per employee (~USD 43,600, in 2008) • Tourists to South Africa from air markets creates more jobs than their land counter-parts, ~6 tourists per employee; this compares well with competitors • South Africa witnessed good growth (~7.9%) in tourist spending per employee between 2002 and 2008 and extracts more value per tourist than Brazil, Kenya and Thailand
8 South AfricaRelative to other markets, SA creates fewer jobs per tourist arrival Tourist Arrival Per Employee2, 2008 Tourist Arrivals per Direct Tourism Employee1 11.2 Australia 7.5 Thailand 2.3 Number of Arrivals per Direct Tourism Employee Brazil 8.1 Kenya 10.6 US 16.1 South Africa Note: 1Number of foreign arrivals per direct tourism employee is calculated as follows: Total International Visitors/Number of people employed in the economy as a direct contribution of the tourism sector; 2Numbers have been validated from respective tourism websites of all the countries. Economy direct employment means employees directly engaged in the Travel and Tourism industry. The value for this parameter is computed by taking into account the GDP contribution of the tourism sector. Economy indirect employment considers employees engaged in intermediate sectors such as suppliers of intermediate inputs to tourism industry as well as suppliers of investment goods to the tourism industry and of goods to tourists overseas such as construction firms building hotels. GDP contribution of respective sector (in which the intermediate supplier falls into) is used to derive this number. For South Africa, it has been assumed, that ~50% of the tourists from Botswana, Lesotho, Mozambique and Swaziland are not tourists, and hence, are not considered for calculations Source: Euromonitor; WTTC; Stats SA
50 South AfricaWhile SA creates fewer jobs per total foreign tourist arrival, it extracts a fairly high value per tourist, better than Brazil, Kenya and Thailand Tourist Spend Per Employee (USD), 2008 Total Spending by International Visitors1 in Country per Direct Employee2 (USD) CAGR (2003–08) 10.8% 43,597 Australia 8,622 15.1% Thailand 14.8% 2,546 Brazil 2.7% 6,135 Kenya 10.6% 23,933 US Amount (USD ‘000) 7.9% 20,729 South Africa South African Tourism could extract more value out of the tourists (as compared to Australia and the USA) – increasing the length of stay could be one way of achieving this Note: 1‘Total Spending by International Visitor’ has been converted from local currencies to USD by using the conversion ratio for each respective year from Oanda.com as shown above; 2Total spending by international visitor in country per employee is calculated as follows: Total Spending by International Visitor/ Number of people directly employed in the tourism sector. The value for this parameter is computed by taking into account the GDP contribution of the tourism sector Source: Tourism Impact Data and Forecast Tool, WTTC; Euromonitor
South AfricaInternal benchmark – tourism’s performance relative to other South African economic sectors • South Africa’s tourism industry contributes substantially to the country’s economy. Driven by a growth in foreign arrivals, its contribution has been increasing in recent years • Between 2002 and 2008 , the overall tourism industry (direct and indirect) has grown in terms of its contribution to GDP at a faster rate than all sectors of the economy • The direct contribution has grown at 10.2% p.a. on par with the construction industry (10.4% p.a.) which is the fastest growing sector of the economy • Growth in GDP contribution has not translated into a commensurate increase direct or indirect employment • Tourism employment witnessed a 3.2% CAGR over 2002–2008 • Employment growth was marginally behind the average growth of all sectors • In absolute terms, the tourism industry is one of the smaller sectors of the economy both in terms of total GDP contribution and direct employment • Also, the employees of the tourism industry contribute substantially to the GDP of the country • In 2008, tourism’s GDP contribution per employee stood at ZAR ~167,000 (direct) and ZAR ~201,000 (indirect) • GDP contribution per employee has witnessed high positive growth over 2002–2008, with direct contribution growing at ~7% CAGR, and indirect contribution growing at ~10%
Tourism’s overall contribution to GDP has grown at a faster rate than most sectors of the economy and as fast as the construction sector 0 CAGR(2002–2008) GDP Contribution1 by Sector (ZAR Bn), 2002–2008 CAGR (2002 – 2008) 2.1% Agriculture, hunting, forestry and fishing 1,620 -0.1% Mining and quarrying 1,560 3.9% 1,478 Manufacturing 1,401 3.8% Electricity, gas and water supply 1,330 297 1,273 1,236 290 10.4% Construction 276 4.6% Wholesale and retail trade 259 244 Constant 2005 prices ZAR Bn 233 220 236 5.3% 218 Transport, storage and communication 207 195 182 173 7.1% Finance, real estate, insurance and business services 168 3.6% 377 Services and others2 349 324 296 280 10.2% 261 Tourism (Direct) 249 13.5% Tourism (Indirect) 195 163 12.2% Tourism (Overall) 140 121 335 106 322 73 103 308 98 297 285 280 270 63 121 99 83 71 62 2002 2003 2004 2005 2006 2007 2008 Note: 1Quarterly value added by industry and gross domestic product at constant 2005 prices; 2For GDP figures, the ‘Services and others’ sector includes ‘general government services’ and ‘personal services’ Source: ‘Gross Domestic Product (GDP), 3rd Quarter 2009’, Stats SA, November 2009; WTTC; Grail Research Analysis
However, this GDP growth did not lead to a commensurate growth in employment despite tourism being a labour intensive industry 6 The tourism sector’s direct contribution to GDP experienced a strong growth between 2002 and 2008, however, the growth in direct employment was marginally below the average of all sectors Growth in Employment vs. Growth in GDP Contribution (CAGR: 2002–2008) A - Agriculture, hunting, forestry and fishing B - Mining and quarrying C - Manufacturing D - Electricity, gas and water supply E - Construction F - Wholesale and retail trade G - Transport, storage and communication H - Financial intermediation, insurance, real estate and business services I - Services and others J – Tourism (Direct) K – Tourism (Indirect) Overall GDP growth over 2002–2008: 4.6% E H D Overall employment growth over 2002–2008: 2.3% K F G I % Growth in Employment J C B A % Growth in Contribution to GDP Note: For employment, ‘Services and others’ includes ‘community, social and personal services’ and ‘private households’. For GDP, ‘Services and others’ includes ‘general government services’ and ‘personal services’. 1Definition of direct and indirect tourism employee is same as Module 1 Source: ‘Labour Force Survey Historical Revision September Series 2000 to 2007’, Stats SA, March 2009; ‘Quarterly Labour Force Survey (QLFS), 3rd Quarter 2009’, Stats SA, October 2009; ‘Gross Domestic Product (GDP), 3rd Quarter 2009’, Stats SA, November 2009; WTTC; Grail Research Analysis
0 Market AccessAccessibility of South Africa as a Tourism Destination Understanding the Accessibility of South Africa as a Tourist Destination • The awareness and brand recall of South Africa as a leisure destination is highest across European countries such as Sweden, the UK and the Netherlands, etc. • In addition to the European countries, Kenya also shows high consideration to visit South Africa in the future • Although India and Italy have low levels of brand recall, they consider South Africa to be a very likeable leisure destination • While the majority of key leisure tourist markets exhibit a high short-term consideration to visit South Africa, only a few actually view South Africa as their favorite destination • South Africa is rated significantly above average for its nature & wildlife offerings, however, tourists across all key markets unanimously perceive South Africa as being unsafe and offering poor value for money • Tourists across key markets prefer to visit a destination that is memorable, enriching, friendly and unique • These tourists perceive South Africa as being adventurous, breathtaking and unique • Tourists primarily use internet search engines and ‘word of mouth’ as the key sources to gather information on South Africa • Travel brochures, and television programs, have been the most successful media to promote South Africa as a tourism brand • Only in Africa, where the internet penetration is low, VFR is the primary reason to visit South Africa • Even after seeking information on South Africa, tourists do not visit South Africa primarily due to safety and security concerns and high costs of travelling • Despite these concerns, a high percentage of tourists continue to recommend South Africa as a leisure destination to their friends and families – indicating an overall positive experience Strength of South Africa as a Brand Source of Information for Tourists Constraints to Visit South Africa
r There are a number of barriers to travel to South Africa. However, the negative perceptions of safety and security and value for money are the biggest barriers 89.51 MM Reasons for Not Visiting South Africa in Past Five Years, 2009 (n=12,911) Target Population Percentage of Respondents 30.95 MM leakage 58.56 MM(65%) Another destination was more appealing Too expensive to get there General issues of safety1 Concerns for my personal safety Uncertain about political climate/civil unrest No particular reason Too expensive once there Don’t know anyone there Not a relaxing destination Nothing interesting to do there Too much time to get there Concern about AIDS Other People who are aware of South Africa 34.4 MM leakage 24.16 MM(41%) Reasons for Not Visiting After Seeking Information on South Africa, 2009 (n=2,023) People aware of South Africa and considering to visit the country 16.57 MM leakage Percentage of Respondents 7.59 MM(33%) People who mentioned that they will visit South Africa in next 18 Months Concerns for my personal safety Nothing interesting to do there General issues of safety1 Too expensive to get there1 Don’t know anyone there Not a relaxing destination Too much time to get there Too expensive once there Other 6.77 MM leakage Actual arrivals from the target segments (in the next 18 months) 0.82 MM Note: Markets include 13 countries, namely Australia, Canada, China, France, Germany, India, Italy, Japan, Kenya, Netherlands, Nigeria, UK and USA Q. Why haven’t you visited South Africa for leisure purposes in the past 5 years?; 1Include concerns over health, weather, roads, crime, etc. Q. After seeking information about South Africa, why are you no longer planning to visit it for leisure travel?; 1Include concerns over health, weather, roads, crime, etc. Source: SAT Brand Tracker (combined samples from February 2009 and November 2009 waves)
37% Overall, value for money contributes toward ~36% of tourists not visiting SA - the price of a plane ticket being the main barrier Overall Value for Money Impact Too expensive to get there Too expensive once there Top reasons for not Visiting South Africa as a leisure Destination in the past 5 Years, 2007–2009 % Respondents 2007 2008 2009 Source: SAT Brand-Tracker Survey 2007–2009; Monitor Analysis
Although general issues of safety and security is one of the reasons for not visiting SA, tourists who have been to SA have a better perception about the country, with their perception having improved over the years. Describes very well Does not describe at all Year
Drivers and Barriers to GrowthCapacity Assessment – Snapshot (1/2) Capacity Assessment • Airlift • Airlift capacity and connectivity is a possible barrier that hinders the growth of the South African tourism industry • In South Africa, the domestic carriers operate at high load factors, and the capacity of international airports only marginally exceeds demand – hence, a possible need for capacity expansion • In Jan 2010, ACSA proposed to increase the air tariffs (including passenger charge, landing fees and rentals) by 133% - together with high fuel prices, this is likely to significantly increase the cost of an air ticket • South Africa is well connected to international locations, but mostly through indirect flights – direct connectivity can result in more tourist inflow Airlift • Car Rental • The car rental industry is a enabler of tourism growth • With increasing fleet size, and low rentals, the car rental industry appears to be becoming more competitive and increasing capacity which is important for the growth of tourism industry, especially in light of the lack of well-developed alternative means of public transport • The success of the industry is, however, sensitive to fuel prices. In the recent past, the industry suffered due to an increase in fuel prices in South Africa Car Rental
c Most load factors on major routes are high (>75%) and load factors on routes to, and from, Netherlands and the route to Australia has increased between 2003 and 2008 Load Factors, Routes Between International Locations and South Africa1, 2003–2008 Route from Destination to SA Route from SA to Destination Australia UK Netherlands US Germany France Load Factor (%) Load Factor (%) 2003 2003 2008 2008 Note: 1Above information is only for direct flights between the departing and arrival country; The six countries chosen in the analysis “International Load Factors” are the top six non-African nations which South Africa receives the maximum number of tourists (Australia, UK, Netherlands, US, Germany, and France) Source: OAG Aviation
% Low cost domestic airlines such as Kulula, 1time, and Mango (~85%) experienced higher load factors than South African Airways (68%) in 2008 Load Factors of South African Airlines, Domestic Airlines, 2008 % Load Factor Kulula 1time Mango Nationwide Airlines South African Airways Airlink SA Express Airways Source: ‘Transportation – South Africa’, Euromonitor, November 2009
Drivers and Barriers to GrowthCapacity Assessment – Snapshot (2/2) Capacity Assessment • Accommodation • The accommodation industry is another driver of tourism industry growth • Occupancy rates in the country have been increasing, along with the increase in average stay unit1 rate • Growth in accommodation industry revenues have been primarily driven by increases in total revenues generated by hotels • Furthermore, with a variety of choices available and abundance of stay units, tourists are spoilt for selection Accommodation • Skills and Service Levels • Access to a skilled workforce with high service levels is a key enabler of growth for the tourism industry • Although, the industry has shown higher employment levels in 2009 the quality and skill level of these employees remain low • The workforce has been severely affected by the prevalence of diseases such as HIV/AIDS – the country has taken several initiatives to improve the health of the workforce by increasing awareness of HIV/AIDS • However, the condition is expected to improve – The DEAT has launched various programs such as ABET-THETA, Tourism Learnership Project (TLP) to improve the skill and service levels in the industry Skills and Service Levels Note: 1A ‘Stay Unit’ is ‘The unit of accommodation available to be charged out to guests, for example, …a room in a hotel’,
Recommendations • The skills and training sector of tourism present the largest and most immediate barrier for future growth • THETA needs to be equipped with the correct levels of capacity to more effectively plan and facilitate skills development in the industry • This should include initiatives to improve the relevance of current training programmes / curriculum and institutional capacity • In order to achieve this, THETA needs to collect in-depth data on human resources within the tourism industry • This will allow THETA to understand, and plan for, current and future skills gaps more effectively • High load factors along key domestic and international routes could become a barrier to growth and needs to be monitored actively • The effects of increased accommodation capacity as a result of the 2010 World Cup on industry occupancy levels should also be actively monitored • Planning for the tourism industry needs to take cognisance of its broader, cross-cutting impact on many industries especially the Retail & Wholesale, Electricity & Gas and Transport industries • More industry collaboration, even at a provincial level, between the tourism sector and industries it influences could facilitate an increase in the total economic contribution of the cluster of industries
Moving forward Moving forward the following aspects are important: • Work with the International Marketing Council to be undertaken to change the perception of ‘Safety and Security’ by potential visitors to SA. Reducing the gap between the perception of those who visit SA and those who do not visit SA will also be important in order to reduce the impact of this concerns on travelling; • Special attentions should be given to perceptions of ‘Value for Money’; • Resourcing of Tourism: The creation of a stand alone Department of Tourism started to address this aspect; • The Sector has for the first time a draft National Tourism Sector Strategy that will guide the sector and ensure alignment and integration with a dedicated focus on competitive advantage for destination South Africa. This needs to be finalised and implemented; • Need to forge relationships with other countries to unlock the potential of tourism through e.g. Comprehensive Tourism Trade Agreements;