Download
1 / 46
460 likes | 594 Vues
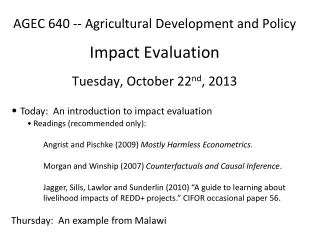
AGEC 640 -- Agricultural Development and Policy Impact Evaluation Tuesday , October 22 nd , 2013. Today: An introduction to impact evaluation Readings (recommended only): Angrist and Pischke (2009) Mostly Harmless Econometrics .

E N D
AGEC 640 -- Agricultural Development and PolicyImpact Evaluation Tuesday, October 22nd, 2013 • Today: An introduction to impact evaluation • Readings (recommended only): • Angrist and Pischke (2009) Mostly Harmless Econometrics. • Morgan and Winship (2007) Counterfactuals and Causal Inference. • Jagger, Sills, Lawlor and Sunderlin (2010) “A guide to learning about livelihood impacts of REDD+ projects.” CIFOR occasional paper 56. • Thursday: An example from Malawi
Evaluating Projects and Policies Types of evaluation: • M&E – track set of project indicators across space and time • Process – assess program operation and adherence to implementation design • Economic – analyze costs/benefits, incentives and behaviors (BCA/CBA) • Sector – review of sector strategy and accomplishments • Impact evaluation – establish a causal effect of a specific program or policy by establishing a counterfactual
Project impacts Outcome With Project Impact Project Intervention ? Without Project
M&E vs. Impact Evaluation • Traditional M&E • Measures trends in indicators and implementation • Are the benefits going to those intended? • Is the project being implemented as planned? • Not focused on causality • Impact evaluation • Measures impact on the beneficiaries that are caused by the intervention/program/policy • Asks: “What are the effects of the intervention?” • Asks: “How would the outcome change if the program or policy changed?” • The focus is on establishing causality (hard!!!)
Key elements of Impact Evaluation • The question of causality makes IE different from other monitoring and evaluation approaches: • Main question is one of attribution– isolating the effects of the program from other factors and potential selection bias: • Counterfactual outcomes (i.e. outcomes for participants not exposed to the program), or • Use survey data to construct comparison groupsfor those who are participants or receive treatment.
The Problem of Sample Selection Bias X T Y • Expectation: T influences Y • Problem:X also influences Y. If T is correlated with X, the estimate of the effect of T on Y is likely to be biased. • Goal:Break the link between X and T
Causation • How to establish that T (treatment, program, policy) causes Y (the outcome): • Does T precede Y in time? • Is T correlated with Y? • Can we rule out or control for other variables(X) that can explain the relationship between T and Y? Key: The researcher must understand the process or theory that generates the data – otherwise you can only establish a correlation between T and Y.
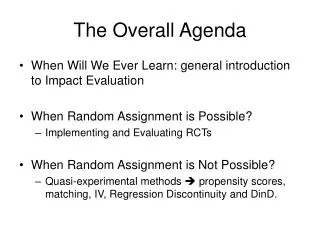
Approaches 1. Make assignment to the treatment group random by construction.This is normally referred to as a “Randomized Control Trial” (RCT) and is the gold standard for impact evaluation studies.(a “natural experiment” might suffice) or 2. Perform regression with adequate controls for X. This is the “standard” regression approach, but may be plagued by the problem that not all elements of X may be observed. This is the problem of unobservables and leads to omitted variable bias.
The most effective way to link interventions/programs to outcomes is by establishing a control group • Outcomes • Intervention/program/policy
Project impacts Outcome With Project Impact Project Intervention ? Without Project
Project impacts Outcome With Project Impact Project Intervention ? Without Project
Project impacts Outcome With Project Impact Project Intervention ? Without Project
Project impacts Outcome With Project Impact Project Intervention ? Without Project
Project impacts Outcome With Project Impact Project Intervention Missing counterfactual Without Project
Confounders – a challenge for causation • The counterfactual should tell us “what would have happened, had there been no policy or treatment?” • In addition to omitted variables, policy evaluation must deal with human behavior (strategic and a source of confounding): • Mimics intervention or masks impacts • Persistent omitted variables • Lack of balance across treatment and control • Potential confounders or omitted variables in policy analysis: • Institutional factors (e.g. other programs, NGOs, etc.) • Biophysical characteristics (e.g. soil conditions) • Psycho-social behavior (e.g. volunteering or targeting) • Historical trends (e.g. high rates of deforestation, political bias, institutional bias, project presence)
Research Designs with ‘Controls’ Outcome with With Project Impact Project Intervention ? Outcome without No Project: “Control”
Outcome variables • Measure progress towards program goals • Should be SMART • Specific focus on what is to be measured • Measurable – clear and unambiguous • Attributable to the project • Realistic – reasonable data collection • Targeted – about target population or site • And, not easily diverted or manipulated
Data • Retrospective vs. prospective study? • What sources have relevant data? • Secondary data • Administrative data, census and other national surveys, academic research, NGOs • Primary data • Project specific • Synergies with other studies • Time frame – do data bracket the intervention? • Is quality adequate? Are definitions sufficient?
Analysis • Difference in means between treatment and control/comparison group – does not account for pre-existing differences; • Multivariate regression – valid only if all differences can be observed and controlled for; • Difference-in-difference – compares indicator values between treatment and control (first difference) and before and after (second difference).
BACI Control After Control Before IMPACT Intervention After Intervention Before
Good impact evaluation will allow you to… • Confidently say whether the intended intervention is “working” i.e. effective in delivering the intended outcomes • Conditional on design, sampling and analysis • What incentives and activities are most effective? • Who benefits or loses? • Where (sites) and when (in production cycle) will we see the best results?
Characteristics of good evaluation study designs • Program (treatment) inputs and activities • Controls (comparisons) counterfactual situation • Baseline – pretest conditions, rates and behaviors • Covariates – correlated with intervention or program • Indicators – unambiguous and sensitive • Sample – detect sizable and significant differences
Example:Income Shocks and Forest Use in Malawi • Research question: • Do households use forests to cope with unexpected events? • Policy importance to environmental protection and poverty reduction.
Motivation • Life is precarious in rural Malawi: • policy shocks (e.g. economic reforms) • illness & death (e.g. HIV/AIDS, malaria) • weather events (e.g. drought, flood) • Missing markets for credit and insurance • coping strategies are “informal” • forests may serve as a “safety net”
Study Sites E major road urban center Blantyre District Mulanje District study site Lake Malawi V3 V1 V2 Blantyre 0 12.5 25 50 Kilometers 0 12.5 25 50 Kilometers
Fieldwork Methods • HH survey • Random selection(natural experiment) • Large variable set. • Quarterly observations • Direct measurements of outcome variables(e.g. quantity of products removed from the forest)
Empirical Approach • Quantify the “effect” of an income shock on wood extracted for marketing (e.g., charcoal, timber, firewood, crafts, bricks, food, drink). • Treatment = an income “shock” (receipt/non-receipt of an input package) • Starter pack is a useful shock measure: • unpredictable at the time (nearly a RCT) • sizable impact (enough to produce effect?) • Positive or negative shock to income?
Marketed Wood Extraction (kg), SP Recipients Positive income shock, decline in forest extraction… Qty. wood extracted (kg)
Marketed Wood Extraction (kg), SP Non-Recipients No positive income shock, increase in forest extraction… Qty. wood extracted (kg)
Recipients Non-recipients Difference-in-Difference (DID) without controls 3000 2500 e c DID Est. of Impact (d-b)-(c-a) 2000 d Qty. wood extracted (kg) 1500 1000 b a 500 0 Season 1 (Before “Treatment”) Season 2 (After “Treatment”)
Recipients Non-recipients Difference-in-Difference (DID) with village controls 2500 2000 DID Est. w/ village controls 1500 Qty. wood extracted (kg) 1000 500 0 Season 1 (Before Treatment) Season 2 (After Treatment)
Empirical Approach • Base DID model: Y= b0 + b1Seas2 + b2Treat + b3(Seas2*Treat) + dX + e DID Est. of Impact • Include interaction terms: Y= b0 + b1Seas2 + b2Treat + b3(Seas2*Treat) + dX + g(Seas2*Treat*X) + e DID Est. of Differential Impact
Random-Effects Tobit Regression Results for forest extraction (n = 198)
Empirical Approach • Include interaction terms to examine differential effects of starter pack: Q = b0 + b1Seas2 + b2Treat + b3(Seas2*Treat) + dX + g(Seas2*Treat*X’) + e X’ = older householder, # adult males, and distance to forest
Differential Effect, by Householder Age Mean 90% CI 0 -50 -100 -150 SP Effect on Wood Extracted (kg) -200 -250 -300 Base HHs (Younger Head) Difference (p = 0.023) “Older” Head
Differential Effect, by Number Adult Males Mean 90% CI 0 -200 -400 SP Effect on Wood Extracted (kg) -600 -800 -1000 -1200 Base HH (No Men) Difference (p = 0.001) One Man in HH
Differential Effect, by Distance to Forest Mean 90% CI 0 -50 -100 SP Effect on Wood Extracted (kg) -150 -200 -250 -300 Base HH (0 km to Forest) Difference (p = 0.047) 1 km to Forest
Conclusion & Implications • Suggestive evidence Malawi smallholders use forests for shock coping • Some evidence that positive income shocks reduced forest use • Some ideas for future research: • larger sample (improved causal analysis) • longer panel (confirm validity of DID) • other shock measures • a more direct approach? • control for more (unobservable) contextual factors (e.g., market conditions, property regime, climate, etc.)
Understand the intervention • Characterize the site • Test hypotheses and revisit assumptions • Develop testable hypotheses • Outcomes • Intervention • Collect data
With thanks to….. Pamela Jagger (UNC)William Sunderlin (CIFOR) Monica Fisher (CIMMYT) Subhrendu Pattanayak (Duke University) Erin Sills (North Carolina State University) for contributions to this presentation