Download
1 / 120
1.2k likes | 1.23k Vues
Learn about scintillation process, NaI(Tl) crystal structure, photomultiplier tube components, calibration, peak broadening, and quality control tests in scintillation detectors. Explore the proportional response of crystals to gamma energy, percent energy resolution calculation, and importance of FWHM. Discover key features of photomultiplier tube construction, photon emissions in crystals, and device function.

E N D
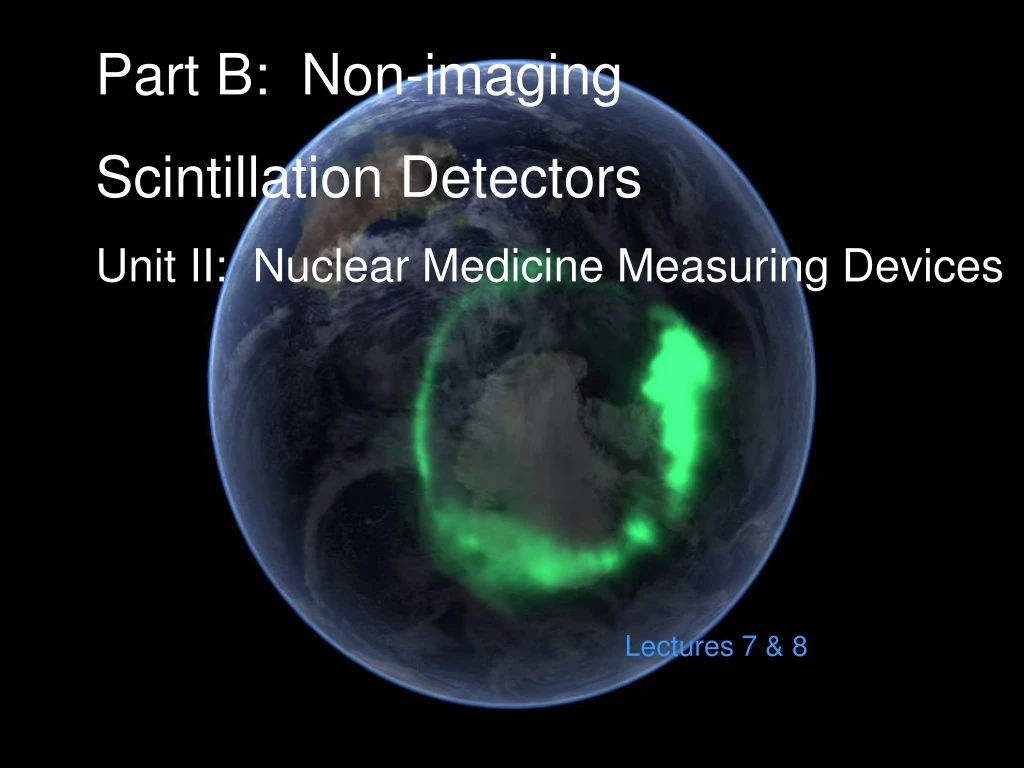
Part B: Non-imaging Scintillation Detectors Unit II: Nuclear Medicine Measuring Devices Lectures 7 & 8
Objectives • Define scintillation • Describe the structure & purpose of a NaI (Tl) crystal and the crystal’s proportional response to deposited gamma energy • Describe the components of a photomultiplier tube and their function • Discuss the purpose of other associated electronics within the scintillation detector • Describe the calibration process for single and multi-channel analyzers • Discuss peak broadening and the determination of a percent energy window • Calculate percent energy resolution from FWHM and its importance in quality control • Describe quality control tests for scintillation detectors and their required frequency
Scintillation Process in NaI(Tl) Paul Early, D. Bruce Sodee, Principles and Practice of Nuclear Medicine, 2nd Ed., (St. Louis: Mosby 1995), pg. 13. http://oldsite.vislab.usyd.edu.au/photonics/devices/semic/images/valcond.gif
Excited Electrons Gamma Photon http://oldsite.vislab.usyd.edu.au/photonics/devices/semic/images/valcond.gif
Visible light (350-500nm λ) Returning electrons http://oldsite.vislab.usyd.edu.au/photonics/devices/semic/images/valcond.gif
http://www.webelements.com/webelements/compounds/media/Na/I1Na1-7681825.jpghttp://www.webelements.com/webelements/compounds/media/Na/I1Na1-7681825.jpg
NaI at Room Temperature Excited Electrons Gamma Photon http://oldsite.vislab.usyd.edu.au/photonics/devices/semic/images/valcond.gif
NaI at Room Temperature Excited Electrons Don’t Fluoresce http://oldsite.vislab.usyd.edu.au/photonics/devices/semic/images/valcond.gif
So we add an impurity – a big ole ugly Thallium Atom Thallium http://www.webelements.com/webelements/compounds/media/Na/I1Na1-7681825.jpg
NaI at Room Temperature Thallium forms a luminescent Center in the gap that catches excited electrons Thallium http://oldsite.vislab.usyd.edu.au/photonics/devices/semic/images/valcond.gif
NaI at Room Temperature When electrons return to the valence band from the gap, they give off light Thallium http://oldsite.vislab.usyd.edu.au/photonics/devices/semic/images/valcond.gif
Therefore, we say our crystal of Sodium Iodide is Thallium Activated Thallium http://www.webelements.com/webelements/compounds/media/Na/I1Na1-7681825.jpg
NaI (Tl) Crystal (hermetically sealed in reflective material) Visible light Gamma Photon Paul Christian, Donald Bernier, James Langan, Nuclear Medicine and Pet: Technology and Techniques, 5th Ed. (St. Louis: Mosby 2004) p 53.
For each keV of gamma photon energy absorbed, 20-30 visible light photons are released by the crystal. Therefore, a 140 keV photon will cause about 3000 visible light photons to be released from the crystal Visible light produced is 325 to 550 nm wavelength 140 keV Gamma Photon
Important Magic to Remember The higher the gamma photon energy : The more visible photons created The visible light emitted from the NaI (Tl) crystal is PROPORTIONAL to the incident energy of the gamma photon.
Timing after a gamma interaction: Scintillation peak in about 30 nsec and about 2/3 of light emitted after 230 nsec At lower rates of interaction (low count rate), a scintillation event typically ends before the next Hence scintillation detectors operate in pulse mode
Photomultiplier Tube http://www.kolumbus.fi/michael.fletcher/pmt_1.jpg
Photomultiplier tubes coupled to NaI(Tl) Crystals http://www.youngin.com/EditData/Editor/211392222620034716115.jpg
Crystal/PMT Interface Simon Cherry, James Sorenson, & Michael Phelps, Physics in Nuclear Medicine, 3d Ed., (Philadelphia: Saunders (Elsevier) 2003), pg. 101.
CsSb Photocathode NaI (Tl) Crystal Gamma Photon Visible Light Emitted electrons from photocathode Optical Window (transparent material)
Quantum Efficiency: A measure of how well a photoemissive material emits electrons when exposed to various wavelengths of light The above graph shows this photoemissive material is most productive at 400 nm—about the same wavelength created by NaI (Tl) scintillation Simon Cherry, James Sorenson, & Michael Phelps, Physics in Nuclear Medicine, 3d Ed., (Philadelphia: Saunders (Elsevier) 2003), pg. 102.
Proportionality Maintained Note: This is the least efficient phase of the transfer For every 3 – 5 visible light photons reaching the photocathode, 1 electron is emitted
Photomultiplier Tube (PMT) Construction Focusing Grid – Guides in Electrons Dynodes – Usually positively charged photoemissive coated electrodes with increasing voltages Anode – end positively charged High voltage power supply – needed to increase incrementally the potential difference between dynodes
Increased voltages between dynodes : means increased KE of electrons between dynodes Increased KE of electrons mean that more electrons are knocked off at each dynode (3X to 6X at each) At 6X each with 10 dynodes means 610 electrons produced (about 60 million) (Still small – 1 Amp = 1 C/s; 1 C = 6.3 X 10¹⁸ electrons)
Proportionality Maintained Millions of electrons are produced by the dynodes in direct response to the initial few electrons emitted by the photocathode in direct response to the visible light photons emitted by the NaI(Tl) crystal in direct response to the energy level of the gamma photon interacting with the crystal End result: Increased gamma energy : means increased electrons reaching the anode at the end of the tube This means that the height of the electric pulse created by the millions of electrons at the anode will be an indicator of gamma energy level
Inefficiencies from the transfer of energy • The proportionality of the system is approximate and contains random statistical error • See Table 2-1 (p. 21) • Note that Tc-99m gamma produces less “information carriers” than the higher energy gamma from Cs-137 • Therefore, Cs-137 has better counting statistics and less variation in the heights of its pulses
From the PMT the signal goes from the anode to the preamp Preamplifier Increases pulse 4X to 5X Matches impedance to the system’s circuitry Paul Christian, Donald Bernier, James Langan, Nuclear Medicine and Pet: Technology and Techniques, 5th Ed. (St. Louis: Mosby 2004) pg 60. Proportionality Maintained
Next the signal goes from the preamp to the amp Amplifier • Pulse undergoes: • 1. Pulse Shaping • Linear Amplification • (Amplified 1 to 100 X • by Gain control) Paul Christian, Donald Bernier, James Langan, Nuclear Medicine and Pet: Technology and Techniques, 5th Ed. (St. Louis: Mosby 2004) pg 60.
Pulse Shaping (Amplifier) From Sodee: “Change to voltage converter that increases the signal-to-noise ratio.” Makes “splat” of voltage pulse into a “pop.” Increases count rate capability of the system Paul Early, D. Bruce Sodee, Principles and Practice of Nuclear Medicine, 2nd Ed., (St. Louis: Mosby 1995), pg. 138.
Pulse Shaping Sorenson, p. 88
Linear Amplification (Amplifier) Each of these pulses represents a different gamma photon energy detected by the NaI (Tl) crystal. We want to preserve this proportionality in the pulses for it represents the proportional differences in the gamma energies detected. But we need a stronger signal to work with. Pulse Voltage Time
Linear Amplification (Amplifier) The linear amplifier amplifies all the pulses proportionally. Pulse Voltage Time
Linear Amplification (Amplifier) Proportionality Maintained Pulse Voltage Time
Linear Amplification (Amplifier) Proportionality Maintained Pulse Voltage Time
From Sodee… “The pulse height is directly proportional to the energy of the incident gamma photon.” Paul Christian, Donald Bernier, James Langan, Nuclear Medicine and Pet: Technology and Techniques, 5th Ed. (St. Louis: Mosby 2004) pg 60. Prekeges, J.
Linear Amplification (Amplifier) The linear amplifier amplifies all the pulses proportionally. Pulse Voltage Time
GAIN 2 5 1 10 We can designate (calibrate) the height of our pulses by Gain Control Pulse Voltage Time
A new set of pulses from photons with the following energies… 230 keV 120 keV 30 keV 80 keV 140 keV 180 keV Pulse Voltage 10 20 30 40 50 60 Time
230 keV 120 keV 30 keV 80 keV 140 keV 180 keV (We have magic eyes and know what these energies are before our detecting system does.) Pulse Voltage 10 20 30 40 50 60 Time
230 keV 120 keV 30 keV 80 keV 140 keV 180 keV For Comparision, We introduce a linear voltage scale… Pulse Voltage 10 20 30 40 50 60 0 25 50 75 100 125 150 175 200 225 250 275 300 Volts Time
GAIN 2 5 1 10 230 keV 120 keV 30 keV 80 keV 140 keV 180 keV We introduce our gain control voltage of our amplifier to increase the voltage pulse heights associated with photons of the given energies Pulse Voltage 10 20 30 40 50 60 0 25 50 75 100 125 150 175 200 225 250 275 300 Volts Time
GAIN 2 5 1 10 230 keV 120 keV 30 keV 80 keV 140 keV 180 keV At gain setting “1” we see the pulse voltages below Pulse Voltage And they appear on our voltage scale as follows… 10 20 30 40 50 60 (Photon energy represented by color points only) 0 25 50 75 100 125 150 175 200 225 250 275 300 Volts Time
GAIN GAIN 2 2 5 5 1 1 10 10 230 keV 120 keV 30 keV 80 keV 140 keV 180 keV Changing the gain to “2” doubles the size of our pulses. Pulse Voltage And Shifts our energy points lineup to the right 10 20 30 40 50 60 0 25 50 75 100 125 150 175 200 225 250 275 300 Volts Time
GAIN GAIN 2 2 5 5 1 1 10 10 230 keV 120 keV 30 keV 80 keV 140 keV 180 keV To amplify our pulses even more, we’ll need to change the scale of our pulse voltages so they will fit on our slide. Pulse Voltage 10 20 30 40 50 60 0 25 50 75 100 125 150 175 200 225 250 275 300 Volts Time
GAIN GAIN 2 2 5 5 1 1 10 10 230 keV 120 keV 30 keV 80 keV 140 keV 180 keV Now that our scale’s adjusted on our graph, we can really start cranking up the gain and see its effects. 50 75 100 125 150 175 200 225 Pulse Voltage 0 25 50 75 100 125 150 175 200 225 250 275 300 Volts Time
GAIN 2 5 1 10 Let’s see what happens when we crank this puppy up to “5.” (5 X the gain!)
GAIN GAIN GAIN 2 2 2 5 5 5 1 1 1 10 10 10 230 keV 120 keV 30 keV 80 keV 140 keV 180 keV 50 75 100 125 150 175 200 225 Pulse Voltage (Notice how these photon energy points spread to the right even more.) 0 25 50 75 100 125 150 175 200 225 250 275 300 Volts Time
GAIN 2 5 1 10 Let’s crank the gain up to “10.” (10 X amplified!!)
GAIN GAIN GAIN GAIN 2 2 2 2 5 5 5 5 1 1 1 1 10 10 10 10 230 keV 120 keV 30 keV 80 keV 140 keV 180 keV 50 75 100 125 150 175 200 225 Pulse Voltage (-Notice how these points representing the different photon energies now line up with our voltage scale?) 0 25 50 75 100 125 150 175 200 225 250 275 300 Volts Time