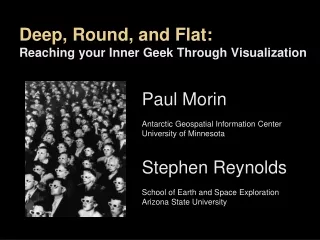
Deep, Round, and Flat: Reaching your Inner Geek Through Visualization
450 likes | 469 Vues
Explore the world of visualization in the Earth Sciences with this comprehensive guide. Learn about the primary barriers to entry, major display issues, and various visualization techniques. Discover how visualization can enhance learning and assessment, and how it can be integrated into classrooms, offices, and labs. With topics ranging from lunar phases to topographic contours, this book is a valuable resource for geology enthusiasts of all levels.

Deep, Round, and Flat: Reaching your Inner Geek Through Visualization
E N D
Presentation Transcript
Deep, Round, and Flat: Reaching your Inner Geek Through Visualization Paul Morin Antarctic Geospatial Information Center University of Minnesota Stephen Reynolds School of Earth and Space Exploration Arizona State University
If you just got rid of maps, rocks and minerals, geology would be a great course. -Student in the University of Minnesota introductory geology course
Visualization is the Primary Barrier to Entry in the Earth Sciences
Four Major Display Issues in Earth Science Visualization Depth Map Projection Real Estate Time
GeoWall Stereo Projection in the classroom, office and lab Computer hardware from Best Buy Passive stereo 20+ people at a time (220 at a time at ASU) Under $10,000 Small and Portable
Lunar Phase Concept Inventory 20 multiple choice questions Covers only lunar phases Pre-test showed UT El Paso students starting at a disadvantage relative to other universities in the US
Lecture Plus GeoWall Using the Lunar Phase Concept Inventory Significant improvements on: Notion of month (97% vs. 76%) CCW orbit (95% vs. 84%) Cause of phases (71% vs 52%) Eclipses (63% vs. 37%) Diff Earth locations (89% vs. 50%) Moon sets in west (66% vs. 47%) Place Moon in 2D orbit (82% vs. 46%) Month between phases (82% vs. 58%) (Turner et al 2003)
Topics with Little or no Differences Moonrise/set times Time between different phases Frequency of a phase Rise/set direction (Turner et al 2003)
Topography without contours No crashing Inexpensive Will work next year Can be used in the field Anaglyph Maps
Student Attitudes Middle school student responses to the statement: "I learned how to understand the maps quickly." Strongly Agree Agree Neutral Disagree Strongly Disagree Murphy, et. al. In press
Use Visualizations for Visual Topics, like Topographic Contours
Reading and Interpreting Other Types of Geologic Information
Visualizations on Globes for Atmospheric/Oceanic/Climate data
How Do We Use Visualizations? In classroom (controlled by instructor) Students use in lab Student controlled versus automatically plays Importance of peer discussion, multiple representations, and the “mouse effect” Students use online without Instructor Infused into textbooks and other instructional materials Used during assessment
Let Students Explore Visual Data Caracas 15.00.a Landslide scars Caracas airport Alluvial fan Caribbean Sea
Animas River Let Students Explore Visual Data
Implications from Cognitiveand Educational Research • We have two processing systems, each with limited working memory • We use some capacity to reconcile images and words
Research Supports Integrating Text into Figures or Using Narration • Two situations • Students using imbedded text retained more and better at transfer (applying knowledge)
Research Supports Limiting Redundancy • Two situations • Figure w/ lengthy explanation • Annotated figure only • Students using only annotated figure retained more and were better at transfer
Integrating Text and Figures in Instruction, Student Learning, and Assessment
Specifically Teach Students What Each Type of Representation Shows
Class Tests of Integrated Visuals and Text Out of 5 possible (average of 8 classes)
Class Tests of Integrated Visuals and Text Out of 5 possible (average of 8 classes)