Download
1 / 3
Télécharger la présentation 
Analysis of Error Scores Using Bland-Altman Plots for Freedson, Trost, and Puyau Equations
An Image/Link below is provided (as is) to download presentation
Download Policy: Content on the Website is provided to you AS IS for your information and personal use and may not be sold / licensed / shared on other websites without getting consent from its author.
Content is provided to you AS IS for your information and personal use only.
Download presentation by click this link.
While downloading, if for some reason you are not able to download a presentation, the publisher may have deleted the file from their server.
During download, if you can't get a presentation, the file might be deleted by the publisher.
E N D
Presentation Transcript
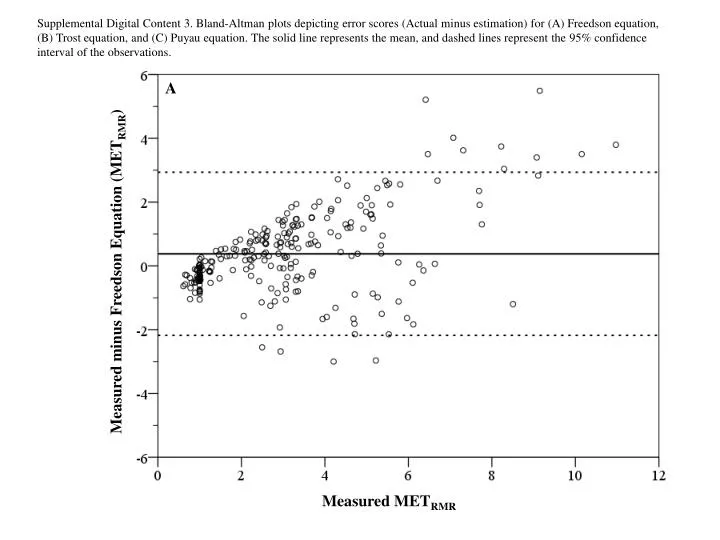
Supplemental Digital Content 3. Bland-Altman plots depicting error scores (Actual minus estimation) for (A) Freedson equation, (B) Trost equation, and (C) Puyau equation. The solid line represents the mean, and dashed lines represent the 95% confidence interval of the observations. Measured minus Freedson Equation (METRMR) A Measured METRMR
B Measured minus Trost Equation (METRMR) Measured METRMR
C Measured minus Puyau Equation (METRMR) Measured METRMR


More Related
Audio
Live Player