Download
1 / 1
60 likes | 382 Vues
Particle Size Analysis using a Beckman Coulter LS13 320. Precision of Laser Diffraction PSA. Particle Size Analysis. Examples of research using laser diffraction particle size analysis.

E N D
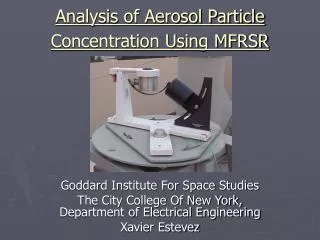
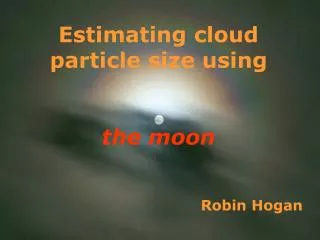
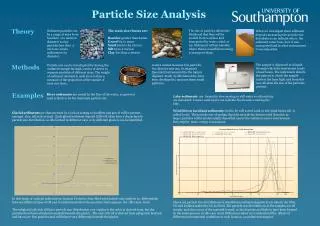
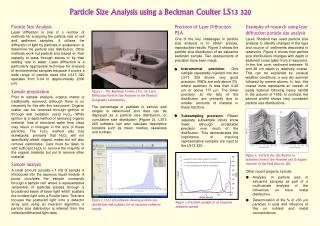
Particle Size Analysis using a Beckman Coulter LS13 320 Precision of Laser Diffraction PSA Particle Size Analysis Examples of research using laser diffraction particle size analysis Laser diffraction is one of a number of methods for analysing the particle size of soil and sediment samples. It utilises the diffraction of light by particles in suspension to determine the particle size distribution. Other methods work out particle size based on their capacity to pass through sieves or by their settling rate in water. Laser diffraction is a particularly appropriate technique for analysis of environmental samples because it covers a wide range of particle sizes (the LS13 320 operates from 0.04 to approximately 2000 m). • One of the key challenges in particle size analysis is to obtain precise, reproducible results. Figure 3 shows the particle size distribution of an estuarine sediment sample. Two assessments of precision have been made: • Instrumental precision. One sample repeatedly injected into the LS13 320 shows very good precision. RSDs are only above 3% where sediment is less than 0.28 mm or above 177 mm. The lower precision at the tails of the distribution are primarily due to smaller amounts of material in these fractions. • Subsampling precision. Fifteen separate subsample inputs show lower, although acceptable precision over much of the distribution. This demonstrates the importance of ensuring representative samples are input to the LS13 320 Laura Shotbolt has used particle size analysis to identify changes in the type and source of sediments deposited in reservoirs. Figure 4 shows how particle size distributions changes with depth in sediment cores taken from 2 reservoirs. In the first core, sediment between 18 and 28 cm depth is relatively coarse. This can be explained by unusual weather conditions: a very dry summer followed by severe storms. In fact, this coarse zone represents an inwash of peaty material following heavy rainfall in the autumn of 1959. In contrast, the second profile shows very consistent particle size distributions. Sample preparation Figure 1. The Beckman Coulter LS13 320 Laser Diffraction Particle Size Analyser in the Physical Geography Laboratories Prior to sample analysis, organic matter is traditionally removed, although there is no necessity for this with this instrument. Organic matter can be removed through ignition or through wet oxidation using H2O2. While ignition is a rapid method of removing organic material, loss of structural water from clays may result in changes in the size of these particles. The H2O2 method also has drawbacks, primarily that H2O2 will not specifically attack organic matter but will also remove carbonates. Care must be taken to add sufficient H2O2 to remove the majority of the organic material, but not to remove other material. The percentage of particles in various size ranges is determined and data can be displayed as a particle size distribution, or cumulative size distribution (Figure 2). LS13 320 software can also calculate descriptive statistics such as mean, median, skewness and curtosis. i ii Figure 4. Particle size distribution in sediments from I) the Howden and ii) Agden reservoir in the Peak District, UK. Sample analysis A small amount (usually < 1 ml) of sample is introduced into the aqueous liquid module. A pump circulates the sample constantly through a sample cell where a representative ‘ensemble’ of particles passes through a broadened beam of laser light which scatters the incident light onto a Fourier lens. This lens focuses the scattered light onto a detector array and, using an inversion algorithm, a particle size distribution is inferred from the collected diffracted light data. • Other recent projects include: • Analysis of particle size in estuarine samples as part of a multivariate analysis of the influences on trace metal distribution. • Determination of the % of <63 mm particles in soils and influence of this on nutrient and metal concentrations. Figure 2. LS13 320 software showing particle size distribution and statistics for an estuarine sediment sample. Figure 3. Precision analysis of an estuarine sediment sample