Download
1 / 15
161 likes | 457 Vues
Analysis of Aerosol Particle Concentration Using MFRSR. Goddard Institute For Space Studies The City College Of New York, Department of Electrical Engineering Xavier Estevez. What are aerosols?. Air consists of molecules of N 2 , O 2 , CO 2 , and various other gases

E N D
Analysis of Aerosol Particle Concentration Using MFRSR Goddard Institute For Space Studies The City College Of New York, Department of Electrical Engineering Xavier Estevez
What are aerosols? • Air consists of molecules of N2, O2, CO2, and various other gases • Aerosols are fine solid or liquid particles suspended in a gas • Some examples of atmospheric aerosols are smoke, sulfates, volcanic ash, pollen, mold spores
Remote Sensing • Is the observation of some attribute of a subject by means that do not involve direct contact with that subject • In other words, “look don’t touch” • A familiar remote sensing system is that of your eyes and brain • Examples of remote sensing: weather radar, satellite imagery, climbing a mountain and looking at things, LIDAR, seismometers, telescopes, radio telescopes, x-rays, MRI. The applications are almost endless.
Remote Sensing of Aerosols • In order to determine the concentration of aerosols in the atmosphere, we use optical remote sensing. • Aerosol particles reflect light. We can detect these particles by measuring the loss of intensity of light as it passes through an aerosol-bearing medium • Different wavelengths of light can detect different particle sizes. • Simply put, short wavelength light detects smaller particles, and long wavelength light detects larger particles Long wavelength light Short wavelength light
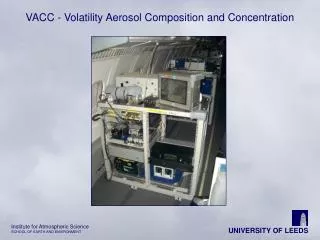
Apparatus Multi-Filter Rotating Shadowband Radiometer • Multi-Filter • Senses several different wavelengths of light • Rotating Shadowband • Has a motorized arm thatperiodically covers the sensor • Radiometer • Measures intensity of solar radiation http://www.yesinc.com/products/data/mfr7/index.html
What Does It Tell Us? The moving shadowband allows one instrument to collect direct and diffuse intensity readings Data analysis tells us how much light is reflected by the atmosphere Variations in this amount are related to concentration of aerosol particles
Methods MFR Laptop Control Unit / Data Acquisition System RS-232 • Data Acquisition System (DAS) controls the MFR, stores data in internal memory • Laptop is connected to the DAS to download the data • Data files are analyzed using various software tools
Program Flow Chart (simplified) Raw input data (23 columns, with outliers) Line Fitter Results List of optical depths For each of 5 different wavelength channels 2-Dimensional Data Array Object Values converted to Secant and log File Splitter Separate files for each morning and afternoon (7 columns, stripped of outliers) Day Processor
Ig = intensity of sunlight as measured at the instrument I0 = intensity of sunlight outside of the atmosphere e = Napier’s constant m = airmass factor t = optical depth Beer’s Law The deeper the glass, the darker the brew, The less the amount of light that gets through Ig = I0 e–mt Loge Ig = Loge I0 – tm • The intensity of the light that reaches the earth’s surface is decreased by two factors– the length of its path through the atmosphere, and the optical properties of the atmosphere • The relationship can be modeled as a linear equation. • The slope of this line is equal to the total optical depth (how effectively the atmosphere blocks light)
Langley Regression Analysis • As the sun moves across the sky, sunlight must pass through varying amounts of air • The light’s path is shortest at noon, and longest at sunrise and sunset • Beer’s law tells us that there is a direct relationship between path length and light intensity– light that passes through a path twice as long is affected twice as much. • We assume that the optical depth of the atmosphere remains constant over a half-day period, and can therefore determine optical depth by plotting light intensity against path length (the secant of the solar zenith angle).
Data Filtering The optical depth for the time period in this graph is equal to the slope of the red line. The red line was not drawn mathematically, it “just looks right” This technique is not statistically valid, we have to use a linear regression equation to draw the trend line That regression applied to this data set would yield a line with a less severe slope and a lower y-intercept, due to the disproportionate effect of outlying points. Secant of solar zenith angle vs. log e Solar radiation intensity (W/m2/nm) 415 nm, afternoon of 22-June-2004
Linear Regression • Linear regression is a technique used to plot a straight line from a 2-dimensional collection of plotted data points • This allows one to model real-world data theoretically • The line produced will pass as closely as possible to as many of the data points as possible • The equation which returns the slope of the best-fit line is as follows:
Results • The final product of my research is a list of optical depths for approximately 70 days, and the Java application that I used to calculate these values. • I do not see any discernible patterns in these optical depths. They do not appear to conform to any linear or periodic functions as far as I can tell.
Discussion • One potential source of error is the fact that due to cloudy or overcast conditions, some days did not yield any acceptable data-points, or yielded too few data-points to obtain any statistically valid trend • Another error source is the fact that even the best data-cleaning algorithm cannot determine with absolute certainty which readings are invalid. • This does not confirm or deny the validity of the results. Further evaluation of the data is needed in order to determine the value
References • “Atmospheric Aerosols: What are they, and why are they so important?” http://oea.larc.nasa.gov/PAIS/Aerosols.html • “Linear Regression”http://www.math.csusb.edu/faculty/stanton/probstat/regression.html • “Excel Tutorial On Linear Regression”http://phoenix.phys.clemson.edu/tutorials/excel/regression.html • “Langley Method”http://www.optics.arizona.edu/rsg/menu_items/resources/equip/langley.htm • “MFR-7 MULTI-FILTER ROTATING SHADOW BAND RADIOMETER”http://www.yesinc.com/products/data/mfr7/index.html