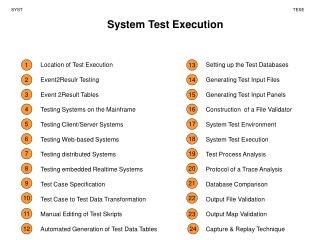
Execution of System Tests
Learn about Modeling Defects State-transition diagram for tracking defects, Orthogonal Defect Classification, Metrics for Monitoring Test Execution, and Defect Causal Analysis.

Execution of System Tests
E N D
Presentation Transcript
Topics Covered Modeling Defects Preparedness to Start System Testing Metrics for Tracking System Test Metrics for Monitoring Test execution Metrics for Monitoring Defect Reports Orthogonal Defect Classification Defect Causal Analysis Beta Testing First Customer Shipment System Test Report Product Sustaining Measuring Test Effectiveness Fault Seeding Spoilage Metric
Modeling Defects A life-cycle model in the form of a state-transition diagram. Explanation of the different states Two key concepts involved in modeling defects are the levels of priority and severity A priority level is a measure of how soon the defect needs to be fixed, i.e., urgency. Critical (1), High (2), Medium (3), and Low(4) A severity level is a measure of the extent of the detrimental effect of the defect on the operation of the product Critical (1), High (2), Medium (3), and Low (4) The defect schema
Modeling Defects State-transition diagram representation of the life-cycle of a defect
Modeling Defects State of a defect model
Modeling Defects Defect schema summary fields
Preparedness to Start System Testing The last item of the entry criteria namely test execution working document is in place and complete, before the start of the system test A framework of such document is outlined in Table below
Metrics for Tracking System Test We categorized execution metrics into two classes: Metrics for monitoring test execution Metrics for monitoring defects
Metrics for Monitoring Test Execution Test case Escapes (TCE) A significant increase in the number of test case escapes implies that deficiencies in the test design Planned versus Actual Execution (PAE) Rate Compare the actual number of of test cases executed every week with the planned number of test cases Execution Status of Test (EST) Cases Periodically monitor the number of test cases lying in different states Failed, Passed, Blocked, Invalid and Untested Useful to further subdivide those numbers by test categories
Metrics for Monitoring Defect Reports Function as Designed (FAD) Count Irreproducible Defects (IRD) Count Defects Arrival Rate (DAR) Count Defects Rejected Rate (DRR) Count Defects Closed Rate (DCR) Count Outstanding Defects (OD) Count Crash Defects (CD) Count Arrival and Resolution of Defects (ARD) Count
Orthogonal Defect Classification Orthogonal Defect Classification (ODC) is a methodology for rapid capturing of the semantics of each software defect. The classification of defects occurs at two different points in time during the life-cycle of a defect In the NEW state, the submitter needs to fill out the following ODC attributes or fields: Activity: This is the actual activity that was being performed at the time the defect was discovered Trigger: The environment or condition that had to exist for the defect to surface Impact: This refers to the effect, the defect would have on the customer, if the defect had escaped to the field.
Orthogonal Defect Classification The owner needs to fill out the following ODC attributes or fields when the defect is moved to RESOLVED state: Target: The target represents the high-level identity, such as design, code, or documentation, of the entity that was fixed Defect type: The defect type represents the actual correction that was made Qualifier: The qualifier specifies whether the fix was made due to missing, incorrect, or extraneous code Source: The source indicates whether the defect was found in code developed in house, reused from a library, ported from one platform to another, or provided by a vendor Age: The history of the design or code that had the problem. The age specifies whether the defect was found in new, old (base), rewritten, or refixed code. New: The defect is in a new function which was created by and for the current project. Base: The defect is in a part of the product which has not been modified by the current project. The defect was not injected by the current project Rewritten: The defect was introduced as a direct result of redesigning and/or rewriting of old function in an attempt to improve its design or quality. Refixed: The defect was introduced by the solution provided to fix a previous defect.
Orthogonal Defect Classification Data assessment of ODC classified data is based on the relationship of the ODC and non-ODC attributes of a defect The assessment must be performed by an analyst who is familiar with the project Once the feedback is given to s/w development team, they can take actions to prevent defects from recurring The ODC analysis can be combined with Pareto analysis to focus on error-prone parts of the software Pareto principle can be stated as concentrate on the vital few and not the trivial many An alternative expression of the principle is to state that 80% of the problems can be fixed with 20% of the effort It is generally called the 80/20 rule
Defect Causal Analysis In DCA, defects are analyzed to Determine the cause of an error Take actions to prevent similar errors from occurring in the future Means to remove similar defects that may exist in the system or to detect them at the earliest possible point in the software development process It is sometimes referred to as defect prevention or root-cause defect analysis (RCA) Three key principles to drive defect causal analysis: Reduce the number of defects to improve quality Apply local expertise where defects occur Focus on systematic errors DCA focuses on understanding of cause-effect relationship There must be a correlation between the hypothesized cause and the effect The hypothesized cause must precede the effect in time The mechanism linking the cause to the effect must be identified
Defect Causal Analysis Linking the causes to the effect consists of five steps: When was the failure detected and the corresponding fault injected? What scheme is used to classify errors? What is the common problem (systematic error)? What is the principal cause of the errors? Cause-effect diagram may be used to identify the cause How could the error be prevented in the future? Preventive: A preventive action reduces the chances of similar problems occurring in the future Corrective: A corrective action means fixing the problems. Attacking the cause itself may not be cost effective in all situations Mitigating: A mitigating action tries to counter the adverse consequences of problems Some Preventive and Corrective actions: Training, Improvement in Communication, Using tools, Process Improvement
Defect Causal Analysis Cause-effect diagram for defect causal analysis (DCA).
Beta Testing Beta testing is conducted by the potential buyers prior to the official release of the product The purpose of beta testing is not to find defects, but to obtain feedback from the field about the usability of the product Three kinds of beta: Marketing beta Technical beta Acceptance beta A decision about when to release the system to the beta customers is made by the software project team members The beta release criteria are established by the project team A framework for writing beta release criteria is given in Table above The system test cycle continues concurrently with beta testing Weekly meetings are conducted with the beta customers by the beta support team to resolve issues.
Beta Testing A framework for beta release criteria
First Customer Shipment A set of generic FCS readiness criteria is as follows: All the test cases from the test suite should have been executed Test case results are updated with Passed, Failed, Blocked, or Invalid status The requirements are updated by moving each requirement from the Verification state to either the Closed or the Decline state The pass rate of test cases is very high, say, 98% No crash in the past two weeks of testing has been observed No known defect with critical or high severity exists in the product Not more than a certain number of known defects with medium and low levels of severity exist in the product All the resolved defects must be in the CLOSED state The user guides are in place Trouble shooting guide is available The test report is completed and approved
Product Sustaining Once the product is shipped to one of the paying customer the software project is moved to sustaining phase The goal of this phase is to maintain the software quality throughout the product’s market life Software maintenance activities occur because software testing cannot uncover all the defects in a large software system The following three software maintenance activities were coined by Swanson: Corrective: The process that includes isolation and correction of one or more defects in the software Adaptive: The process that modifies the software to properly interface with a changing environment such as new version of hardware or third party software Perfective: The process that improves the software by the addition of new functionalities, enhancements, and/or modifications to the existing functions
Product Sustaining The first major task is to determine the type of maintenance task to be conducted when a defect report comes in from a customer The sustaining team, which include developers and testers are assigned immediately to work on the defect If the defect reported by the customer is considered as corrective in nature The status of the progress is updated to the customer within 24 hours The group continues to work until a patch with the fix is released to the customer If the defect reported is considered as either adaptive or perfective in nature it is entered in the requirement database, and it goes though the usual software development phases
Product Sustaining The major tasks of sustaining test engineers are as follows: Interact with customer to understand their real environment Reproduce the issues observed by the customer in the laboratory environment Once the root cause of the problem is known, develop new test cases to verify it Develop upgrade/downgrade test cases from the old image to the new patch image Participate in the code review process Select a subset of regression tests from the existing pool of test cases to ensure that there is no side effect because of the fix Execute the selected test cases Review the release notes for correctness Conduct experiments to evaluate test effectiveness
Measuring Test Effectiveness Defect Removal Efficiency (DRE) metric defined as follows:
Fault Seeding Fault seeding approach is used to estimate the # of escaped defects Inject a small number of defects into system Measure the percentage of defects that are uncovered by the test engineers Estimate the number of actual defects using an extrapolation technique
Spoilage Metric Defects are injected and removed at different phases of a software development cycle The cost of each defect injected in phase X and removed in phase Y increases with the increase in the distance between X and Y An effective testing method would find defects earlier than a less effective testing method would An useful measure of test effectiveness is defect age, called PhAge Scale for defect age
Spoilage Metric Defect injection and versus discovery on project Boomerang
Spoilage Metric Number of defects weighted by defect age on project Boomerang
Spoilage Metric The spoilage value for the Boomerang test project is 2.2 A spoilage value close to 1 is an indication of a more effective defect discovery process As an absolute value, the spoilage metric has little meaning This metric is useful in measuring the long-term trend of test effectiveness in an organization
References Notes from: Software Testing and Quality Assurance :Theory and Practice By Sagar Naik & Piyu Tripathy