Genetics and Human Variation: A Comprehensive Workshop
630 likes | 653 Vues
Explore the paradigm clash in genetics and human variation, including polygenic traits, multifactorial disease models, genetic epidemiology, and variance sources. Learn about disentangling genetic and environmental influences through various study designs.

Genetics and Human Variation: A Comprehensive Workshop
E N D
Presentation Transcript
Genetics and Human variation Nick Martin Queensland Institute of Medical Research Boulder workshop: March 4, 2002
Paradigm clash ? • Genes which cause X, rather than genes which cause variation in X • not necessarily same (e.g. having a nose vs nose size ?) - but often so • physiologists, experimental psychologists, sociobiologists vs. Quant Genet, BG, GenEpi • see Baker BS, Taylor BJ, Hall JC (2001) Are complex behaviors specified by dedicated regulatory genes ? Cell 105:13-24.
Individual differences • Physical attributes (height, eye color) • Disease susceptibility (asthma, anxiety) • Behavior (intelligence, personality) • Life outcomes (income, children)
Continuous or Categorical ? • Body Mass Index vs “obesity” • Blood pressure vs “hypertensive” • Bone Mineral Density vs “fracture” • Bronchial reactivity vs “asthma” • Neuroticism vs “anxious/depressed” • Reading ability vs “dyslexic” • Externalizing behavior vs “delinquent”
Central Limit Theorem • The normal distribution is to be expected whenever variation is produced by the addition of a large number of effects, non-predominant • This plausibly holds quite often
1 Gene 3 Genotypes 3 Phenotypes 2 Genes 9 Genotypes 5 Phenotypes 3 Genes 27 Genotypes 7 Phenotypes 4 Genes 81 Genotypes 9 Phenotypes Polygenic Traits
Multifactorial Threshold Model of Disease Multiple thresholds Single threshold unaffected affected normal mild mod severe Diseaseliability Disease liability
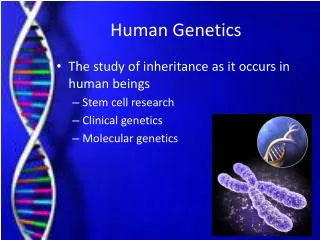
Genetic Epidemiology • Establishing the role of genes and environment in variation in disease and complex traits • Finding those genes
Genetically Complex Diseases • Imprecise phenotype • Phenocopies / sporadic cases • Low penetrance • Locus heterogeneity/ polygenic effects
Complex Trait Model Linkage Marker Gene1 Linkage disequilibrium Mode of inheritance Linkage Association Gene2 Disease Phenotype Individual environment Gene3 Common environment Polygenic background
3 Stages of Genetic Mapping • Are there genes influencing this trait? • Genetic epidemiological studies • Where are those genes? • Linkage analysis • What are those genes? • Association analysis
Sources of variance • Additive genetic - A • Interaction between alleles at same locus (dominance) or different loci (epistasis) – D • Common environmental influences shared by members of the same family – C • Non-shared environmental influences unique to the individual – E • Measurement error (confounded with E) unless replicate test-retest sample
Designs to disentangle G + E Resemblance between relatives caused by: • shared Genes (G = A + D) • environment Common to family members (C) Differences between relatives caused by: • nonshared Genes • Unique environment (U or E)
Designs to disentangle G + E • Family studies – G + C confounded • MZ twins alone – G + C confounded • MZ twins reared apart – rare, atypical, selective placement ? • Adoptions – increasingly rare, atypical, selective placement ? • MZ and DZ twins reared together • Extended twin design
Designs to disentangle G + E • Family studies – G + C confounded • MZ twins alone – G + C confounded • MZ twins reared apart – rare, atypical, selective placement ? • Adoptions – increasingly rare, atypical, selective placement ? • MZ and DZ twins reared together • Extended twin design
MZ concordance for human conditions • Asthma 45% • Eczema 84% • Diabetes (type I) 56% • Schizophrenia 50% • Cleft lip/palate 30% • Club foot 23% • Homosexuality (M) 18% • Homosexuality (F) 23%
Designs to disentangle G + E • Family studies – G + C confounded • MZ twins alone – G + C confounded • MZ twins reared apart – rare, atypical, selective placement ? • Adoptions – increasingly rare, atypical, selective placement ? • MZ and DZ twins reared together • Extended twin design
MZ twins reared apart - note the same way of supporting their cans of beer
Body postures of MZ twins reared apart Body postures of DZ twins reared apart
Designs to disentangle G + E • Family studies – G + C confounded • MZ twins alone – G + C confounded • MZ twins reared apart – rare, atypical, selective placement ? • Adoptions – increasingly rare, atypical, selective placement ? • MZ and DZ twins reared together • Extended twin design
Percentage of adoptees convicted of violent and property offenses by biological parents’ convictions • Denmark • 14,427 nonfamilial adoptions 1927-47 • Court convictions available for biological and adoptive parents • Mednick et al (1984) Science 224:891-4
Designs to disentangle G + E • Family studies – G + C confounded • MZ twins alone – G + C confounded • MZ twins reared apart – rare, atypical, selective placement ? • Adoptions – increasingly rare, atypical, selective placement ? • MZ and DZ twins reared together • Extended twin design
Placentation and zygosity Dichorionic Two placentas MZ 19% DZ 58% Dichorionic Fused placentas MZ 14% DZ 42% Monochorionic Diamniotic MZ 63% DZ 0% Monochorionic Monoamniotic MZ 4% DZ 0%
Identity at marker loci - except for rare mutation MZ and DZ twins: determining zygosity using ABI Profiler™ genotyping (9 STR markers + sex) MZ DZ DZ
Twin studies that changed the world • Multiple sclerosis • Autism • ADHD • Schizophrenia
Total mole count for MZ and DZ twins MZ twins - 153 pairs, r = 0.94 DZ twins - 199 pairs, r = 0.60 400 400 300 300 Twin 1 Twin 1 200 200 100 100 0 0 0 100 200 300 400 0 100 200 300 400 Twin 2 Twin 2
Decomposing variance E Covariance A C 0 Adoptive Siblings 0.5 1 DZ MZ
Path analysis • allows us to diagrammatically represent linear models for the relationships between variables • easy to derive expectations for the variances and covariances of variables in terms of the parameters of the proposed linear model • permits translation into matrix formulation (Mx)
C D E A Variance components Additive Genetic Effects Dominance Genetic Effects Unique Environment Shared Environment c a e d Phenotype P = eE + aA + cC + dD
ACE Model for twin data 1 MZ=1.0 / DZ=0.5 E C A A C E e c a a c e PT1 PT2
A = 64%, C = 30%, E = 6% drop A, Χ21= 124.0 (P < .001) drop C, Χ21 = 13.2 (P < .001) therefore can’t drop A or C and can’t drop E ! Fit of ACE model to mole count
Both continuous and categorical variables Systematic approach to hypothesis testing Tests of significance Can be extended to: More complex questions Multiple variables Other relatives Structural equation modeling
SEM : more complex questions • Are the same genes acting in males and females ? (sex limitation) • Role of age on (a) mean (b) variance (c) variance components • Are G & E equally important in age, country cohorts ? (heterogeneity) • Are G & E same in other strata (e.g. married/unmarried) ? ( G x E interaction)
E G VAR 1 VAR 2 VAR 3 E E G G G E
Sources of variation in male sexual orientation EC AC 0.30 0.70 Homosexuality 0.94 0.73 0.88 Orientation of sexual feelings Number of same-sex partners Attitude to sex with a man EP AF AP AA EA EF < 0.01 0.04 0.08 0.16 0.11 0.06
Direction of causation modeling with cross-sectional twin data c D c Model df AIC 2 2 Full Bivariate 145.66 107 -69.34 Reciprocal 146.00 108 .34 -70.00 Distress Parenting 161.74 109 16.08 -56.26 è Parenting Distress 146.71 109 1.05 -71.29 è No causation 376.29 110 230.63 156.29 Final 151.26 116 5.60 -80.74 A A E C E .20 .45 .25 .38 .55 DISTRESS PARENTING + .18 .56 .63 .52 .49 .16 .67 DEP ANX SOM COLD OVERP AUTON C E A E A E C E A C E C E .36 .13 .21 .11 .40 .17 .26 .21 .14 .49 .11 .37
Designs to disentangle G + E • Family studies – G + C confounded • MZ twins alone – G + C confounded • MZ twins reared apart – rare, atypical, selective placement ? • Adoptions – increasingly rare, atypical, selective placement ? • MZ and DZ twins reared together • Extended twin design
cm cm cf mf mm cm • Extended kinship model • twins • siblings • parents • children • grandparents • aunts, uncles • cousins Male- specific Additive Genes Gender-common Additive Genes Male- specific Additive Genes Gender-common Additive Genes Female Unique Environment Male Unique Environment 0.5 0.5 0.5 ef hmm 0.5 em 0.5 0.5 Female Twin Environment Male Twin Environment 0.5 hfc hmc 0.5 tf tm sf Female Sibling Environment sm Male Sibling Environment Female parent Male parent wfm wmf df wmm dm wff Female Dominant Genes Male Dominant Genes Male- specific Additive Genes Male- specific Additive Genes Gender-common Additive Genes Gender-common Additive Genes Female Unique Environment Male Unique Environment hmm hfc ef em hmc rt tm tf Female Twin Environment Male Twin Environment Female twin Male twin sf sm Female Sibling Environment rs Male Sibling Environment df dm Male Dominant Genes rd Female Dominant Genes
3 Stages of Genetic Mapping • Are there genes influencing this trait? • Epidemiological studies • Where are those genes? • Linkage analysis • What are those genes? • Association analysis