1 / 1

Comparative Analysis: Assembly Hours per Vehicle 2005 vs. 2004

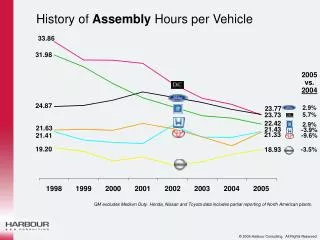
Explore the historical changes in assembly hours per vehicle between 2005 and 2004, with insights into the fluctuations across various automakers. General Motors' exclusion of Medium Duty and partial reporting by Honda, Nissan, and Toyota are noted.

Télécharger la présentation

Comparative Analysis: Assembly Hours per Vehicle 2005 vs. 2004

An Image/Link below is provided (as is) to download presentation Download Policy: Content on the Website is provided to you AS IS for your information and personal use and may not be sold / licensed / shared on other websites without getting consent from its author. Content is provided to you AS IS for your information and personal use only. Download presentation by click this link. While downloading, if for some reason you are not able to download a presentation, the publisher may have deleted the file from their server. During download, if you can't get a presentation, the file might be deleted by the publisher.

E N D

Presentation Transcript


  1. History of Assembly Hours per Vehicle 2005vs.2004 2.9% 5.7% 2.9% -3.9% -9.6% -3.5% GM excludes Medium Duty. Honda, Nissan and Toyota data includes partial reporting of North American plants.

More Related