Download
1 / 32
320 likes | 421 Vues
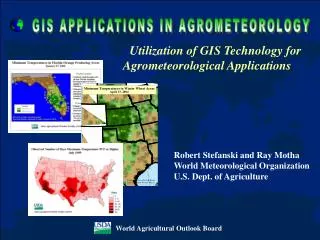
World Agricultural Outlook Board Interagency Commodity Estimates Committee Forecasts. Lockup Briefing September 11, 2014. World Wheat Production. World Wheat Supply and Use. U.S. Wheat Supply and Demand. World Rice Production. World Rice Supply and Use.

E N D
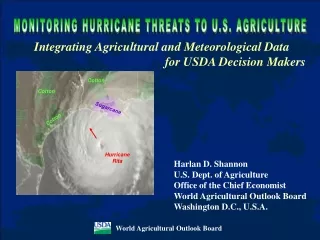
World Agricultural Outlook BoardInteragency Commodity Estimates Committee Forecasts Lockup Briefing September 11, 2014
World Wheat Production September 11, 2014
World Wheat Supply and Use September 11, 2014
U.S. Wheat Supply and Demand September 11, 2014
World Rice Production September 11, 2014
World Rice Supply and Use September 11, 2014
U.S. Rice Supply and DemandRough Equivalent of Rough and Milled Rice September 11, 2014
World Corn Production September 11, 2014
As of September 9, cumulative yield in the Southern District is reported at 5.07 t/ha (8% above the same date last year) with harvest 28 percent complete. Results from individual territories: • In Krasnodar (Southern), yield is up 14% from last year with harvest 38% complete. • In Rostov (Southern), yield is down 2% with harvest 14% complete. • In Stavropol (North Caucasus), yield is up 5% with harvest 18% complete. • In Belgorod (Central), yield is down 6% with harvest 6% complete. September 11, 2014 Source: Ministry of Agriculture
Yield – 5.9 T/Ha Weather problems in 2003, 2007, and 2009 September 11, 2014 USDA/FAS/OGA
World Corn Supply and Use September 11, 2014
U.S. Corn Supply and Demand September 11, 2014
World Soybean Production September 11, 2014
Canada Rapeseed Production September 11, 2014
Statistics Canada’s Rapeseed Expected vs Actual Difference September 11, 2014
Brazil: Soybean 2014/15 Area Increases to a Record Soybean area up 4.7 percent from last year Eighth year of expanding soybean area, but for different reasons Converted pasture and cerrado Northeastern Mato Grosso. New frontier--MaPiToBa: Maranhao, Piaui, Tocantins, and Bahia Better economic returns than corn Southern states of Parana and Rio Grande do Sul September 11, 2014
Shift from Southern Brazil to Center-West Brazil’s Soybean Production by Region Southern states: Parana, Rio Grande do Sul and Santa Catarina Center-west states: Mato Grosso, Mato Grosso do Sul and Goias September 11, 2014
U.S. Soybean Supply and Demand September 11, 2014
World Cotton Production September 11, 2014
World Cotton Supply and Use September 11, 2014
U.S. Cotton Supply and Demand September 11, 2014
Mexico Sugar Supply and Demand September 11, 2014
U.S. Sugar Supply and Demand September 11, 2014
U.S. Meat Production and Prices September 11, 2014
U.S. Meat TradeMillion Pounds September 11, 2014
U.S. Milk Supply and Demand September 11, 2014
U.S. Dairy Product Prices September 11, 2014
U.S. Production Summary September 11, 2014
Domestic Demand Summary September 11, 2014
U.S. Export Summary September 11, 2014
Price Summary September 11, 2014