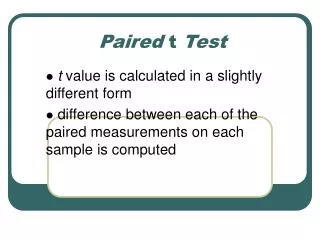
Paired t- test - Example
Paired t- test - Example. OISE sponsored summer institute to improve the skills of high school teachers of foreign languages. One such institute hosted 20 French teachers for four weeks. At the beginning of the period the teachers were given the Modern Language Association’s listening

Paired t- test - Example
E N D
Presentation Transcript
Paired t- test - Example • OISE sponsored summer institute to improve the skills of high school teachers of foreign languages. One such institute hosted 20 French teachers for four weeks. At the beginning of the period the teachers were given the Modern Language Association’s listening test of understanding spoken French. After 4 weeks of immersion in French, the listening test was given again. The data is given in the following slide. Dose the data provide evidence that the course improves French-spoken language skills? week 13
Data Display Row Teacher Pretest Posttest improvement 1 1 30 29 -1 2 2 28 30 2 3 3 31 32 1 4 4 26 30 4 5 5 20 16 -4 6 6 30 25 -5 7 7 34 31 -3 8 8 15 18 3 9 9 28 33 5 10 10 20 25 5 11 11 30 32 2 12 12 29 28 -1 13 13 31 34 3 14 14 29 32 3 15 15 34 32 -2 16 16 20 27 7 17 17 26 28 2 18 18 25 29 4 19 19 31 32 1 20 20 29 32 3 week 13
One sample t-test for the improvement T-Test of the Mean Test of mu = 0.000 vs mu > 0.000 Variable N Mean StDev SE Mean T P improvem 20 1.450 3.203 0.716 2.02 0.029 • MINITAB commands for the paired t-test Stat > Basic Statistics > Paired t Paired T-Test and Confidence Interval Paired T for Posttest – Pretest N Mean StDev SE Mean Posttest 20 28.75 4.74 1.06 Pretest 20 27.30 5.04 1.13 Difference 20 1.450 3.203 0.716 95% CI for mean difference: (-0.049, 2.949) T-Test of mean difference=0 (vs > 0): T-Value = 2.02 P-Value = 0.029 week 13
Character Stem-and-Leaf Display Stem-and-leaf of improvement N = 20 Leaf Unit = 1.0 2 -0 54 4 -0 32 6 -0 11 8 0 11 (7) 0 2223333 5 0 4455 1 0 7 week 13
Goodness of Fit Tests • The goal of χ2 goodness of fit tests is to test is the data comes from a certain distribution. • There are various situations to which these tests apply. • The first situation we will explore is when we observe count data in k different categories. • The aim is to test the null hypothesis that the probabilities of the k categories are p1, p2,…,pk. • We distinguish between two cases. week 13
Case 1 • The null hypothesis completely specifies the probabilities of each of the k categories. • For each category we calculate the expected count Ei = npi. • The test statistic and its distribution are… week 13
Example • The statistic department at U of T offers introductory courses for students from other disciplines. The department believes that 40% of the students are math major, 30% are computer science, 20% biology and 10% chemistry. A random sample of 120 students revealed 52, 38, 21, and 9 from the four majors above. Does this data support the department claim? week 13
Case 2 • The null hypothesis does not fully specify the probabilities. • In this case the probabilities of the different categories may be functions of other parameters. • First use the sample data to estimate r unknown parameters. • Then use the estimated parameters to estimate the k probabilities. • For each category, calculate the estimated expected count. • The test statistic is… week 13
Example • A farmer believes that the number of eggs a chicken will give per day has a Poisson(λ) distribution. He observed the following data…. week 13
Remark • In many cases we will observe data that are not categorized and we would want to test is the data comes from a certain distribution. • If the distribution we are testing is discrete the values of the variable will be the actual categories. • However, if the variable takes infinite possible values, the grouping should be done so that the expected frequency in each category is at least 5. • If the distribution we are testing is continuous we need to group the measurement of the random variable of interest into k intervals. Very often the choice of cells is done arbitrarily. week 13
Contingency Tables • The goal is to test if two categorical variables are independent. • The row variable has r categories while the column variable has c categories. • The data is the count of observations in the rxc table… • The null hypothesis states that the row variable and the column variable are independent. The alternative states that the variables are dependent. • To conduct the test, we calculate the expected count for each cell… • The test statistic and its distribution is…. week 13
Example week 13