Download
1 / 1
10 likes | 250 Vues
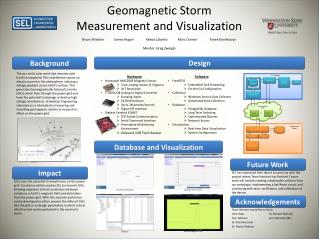
Bryan Wisdom James Hogan Kekoa Caberto Marc Doman Yanek Kondryszyn Mentor: Greg Zweigle. Design. Background.

E N D
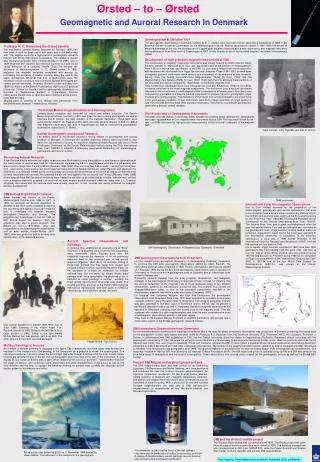
Bryan Wisdom James Hogan KekoaCabertoMarc Doman YanekKondryszyn Mentor: Greg Zweigle Design Background The sun emits solar wind that interacts with Earth’s ionosphere. This interference causes an electric current in the atmosphere, inducing a voltage gradient across Earth’s surface. This generates Geomagnetically Induced Currents (GICs) which flow through the power grid and have the potential to damage or destroy high voltage transformers. Schweitzer Engineering Laboratories is interested in measuring and recording geomagnetic activity to research its effect on the power grid. • Hardware • Honeywell HMC2003 Magnetic Sensor • 3 axis analog output (1 V/gauss) • 4nT Resolution • Ti ADS1248 Analog to Digital Converter • 8 analog inputs • 24 Bit Resolution • Up to 2Ksamples/second • Digital SPI Interface • DigilentCerebot 32MX7 • TCP Socket Communication • Serial Command Interface • Preemptive Multitasking Environment • Onboard USB Flash Backup • Software • FreeRTOS • Embedded Task Scheduling • On-the-Go Configuration • Collection • Windows Service Data Collector • Automated Data Collection • Database • PostgreSQL Database • Long Term Archiving • Sophisticated Queries • Network Access • Visualization • Real-time Data Visualization • System Configuration PC - Software Geomagnetic StormMeasurement and Visualization Configuration Analysis & Visualization database User via PC Data Access Data Collection Communication Layer Wired Wireless OR Magnetometer System Device Interface & Control Short Term Data Storage Processing Timing Database and Visualization Magnetometer Future Work Photo courtesy of A. Pulkkinen via Wikipedia.com - Variations of the ionospheric currents I(t) generate an electric field E(t) driving GIC [1]. Impact SEL has expressed their desire to continue with the project where Team Harrison has finished. Future work will include creating a deployable solution from our prototype, implementing a Set/Reset circuit, and continuing with tests, verification, and calibration of the device. GICs have the potential to wreak havoc on the power grid. Our device will be used by SEL to research GICs, allowing engineers to find correlations between variations in Earth’s magnetic field and data taken from the power grid. With this research protection can be developed to either prevent the influx of GICs into the grid or to design parameters in which critical infrastructure can be protected in the event of a storm. Visualization Workspace Magnetic Field Timeline Acknowledgements Real-time Magnetic Field Database