Download
1 / 30
300 likes | 320 Vues
Explore the water-energy nexus in California using WEAP and LEAP models, analyzing challenges, policies, and solutions for sustainable goals and climate adaptations. Discover insights into water sufficiency, energy systems, and GHG mitigation strategies.

E N D
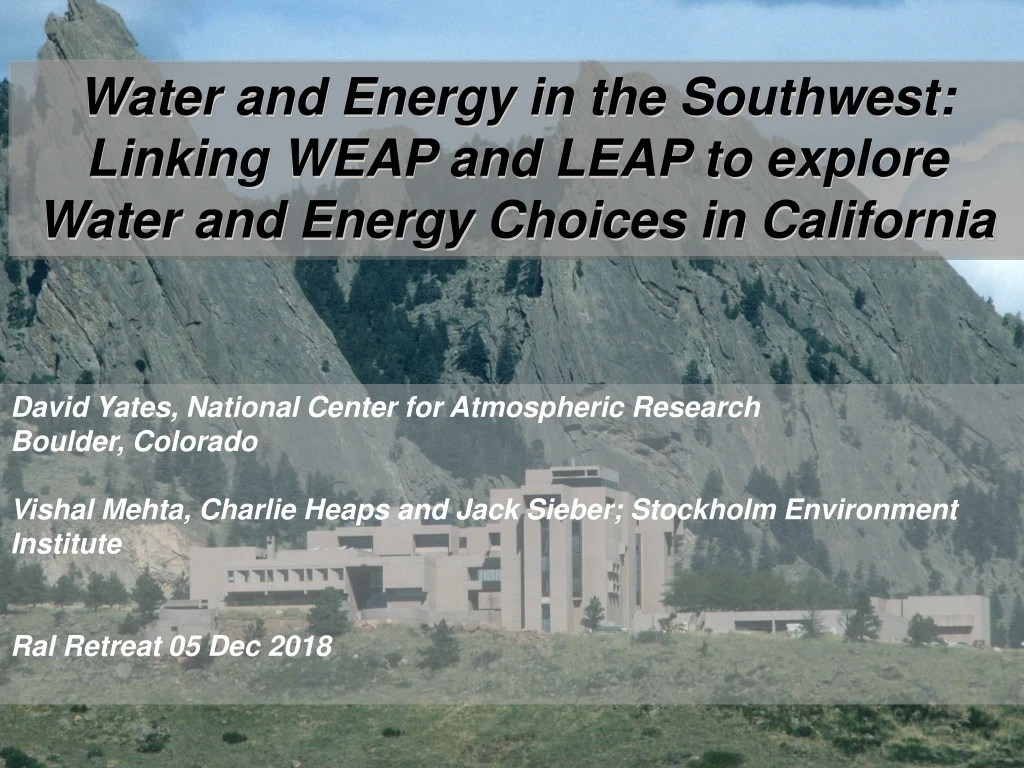
Water and Energy in the Southwest: Linking WEAP and LEAP to explore Water and Energy Choices in California David Yates, National Center for Atmospheric ResearchBoulder, Colorado Vishal Mehta, Charlie Heaps and Jack Sieber; Stockholm Environment Institute Ral Retreat 05 Dec 2018
Challenges in Representing the W-E Nexus (Meeting GHG Emission Targets) • Policies aimed at sustainable goals in one realm can conflict with those in an other. • Complexity of water, energy and climate linkages. • Examples: • Increased bio-fuel and hydropower production leads to an increase in water use (already limited in some areas). • Desalinization provides a water source but creates brine water stream resulting in environmental problems and increases energy use.
Developing Analytics of the Water-Energy Nexus Water (WEAP) • Climate is a key driver of water systems. • Focus is water sufficiency and climate adaptation. • Energy dimension provides new insights into mitigation potential in the water sector. Energy (LEAP) • Energy systems are a driver of climate change • Focus is energy sufficiency and GHG mitigation. • Water dimension provides new insights into how climate adaptation could affect energy systems. V. Mehta, D. Purkey, C. Heaps, J. Seiber D. Yates and K. Miller
www.weap21.org www.energycommunity.org
California GHG Emissions 431 (2020*) 260 (2030) 90 (2050) *1990 level-AB32 Assumption: If Electricity Sector is ~ 20% of emissions Currently Contributes about 80 MMTCO2e; with 2050 goal of about 15 to 20 MMTCO2e
California GHG Emissions Under 2 MOU – 2 mt/cap
Water in California • Wet, cool winters is in contrast with the timing of peak energy and water demand in the hot, dry summers. • Highest Water Use in USA (55 BCM withdrawal) • Serves largest population center in the USA • 10,000’s of km2 of agricultural land (75% total water withdrawal) • > 1400 dams • 1,000’s of km of canals, aqueducts and irrigation ditches • Water is transported both across and into state (SWP, CVP) • 30% of supply is from groundwater • Some estimates have water at 20% of California’s electricity use.
Electricity in California • Leader in efficiency and climate mitigation policy • Total Use 285 TWh /yravg 2000-2010 • 70% generated from CA owned power plants inside and outside CA • Hydropower varies 48 TWh in 2006 (wet), 14 TWh during prolonged drought (2012-2015) U.S. Energy Information Administration, Electric Power Monthly, February
CALIFORNIA Case-Study Horizon Assumption: 2021 to 2030 Monthly timestep • LEAP • Electricity Demand • Geographic • Buildings and Industry • Water Sector from WEAP • Electricity Generation • Gas, Coal • Hydropower From WEAP • GHG Emissions Delta • WEAP • Climate Driven Hydro • 300+ Watersheds • 63 Rivers/24 GW Basins • 53 Reservoirs, >125 BMC • Demand • M&I Demand • Agricultural Demand • Thermal cooling from LEAP • Hydropower to LEAP US-Mexico Treaty A water resources model to explore the implications of energy alternatives in the southwestern USD Yates, Kristen Averyt, Francisco Flores-Lopez, J Meldrum, S Sattler, J Sieber and C Young, 2013 Environ. Res. Lett. 8 045004
Developed Geo-spatial Statistical models of electricity Demand Monthly Residential Energy Consumption vs Max Monthly Temperature (1990-2010)
California Electricity: Overall and Water Sector Electricity Consumed by Water Activity, Including end-use. Electricity (kWh/cap) Total Energy (Mil Btu) California = 7,000 (51st) 197 (49th) Colorado = 10,000 (39th) 272 (34th) US Avg = 12,000 348
California Electricity: Demand/Fuel(some WEAP/LEAP Results) Electricity Use by Sector Electricity Generation by Fuel HYDRO Wind, Solar Natural Gas (35%) Nuclear (13%) Imports (30%) 250 to 300 GWh 80 to 90+ MMT CO2 Equiv. (20%) The state's main challenge is to ensure adequate electricity supplies while reducing greenhouse gas emissions as directed by AB 32 (10% reduction by 2020; 40% 2030; 80% 2050).
Demonstrate Model with 4 Scenarios • Historic- Generation Portfolio Stays the Same- Water and Electricity Patterns remain. Moderate Population Growth. • Demand • Electricity Use Becomes Exceedingly Efficient (towards 1000 kWh/HH; commercial space to 1/3 of current/sqft) • Per-capita Indoor Water Use to International Minimum Standard (45 gpcpd); Eliminate Flood Irrigation (sprinkler and drip only). • Supply • Prioritize renewables as fuel source. • Eliminate Trans-basin Diversions (local sources only). • Integrated- Combines Demand and Supply Side Assumptions
Next Steps • Incorporate Social Cost into the Analysis. Finalizing the assumptions regarding the unit (levelized) cost for each type. • $ kWh for each fuel type • $ M^3 for each water source. • Most Challenging… What are the assumed costs of improved conservation and efficiency. • Finalize Scenarios • Finish Paper
Residential Energy Use Rates Assumptions Historical Data from USEAI and US Census Most efficient house can be 98% more energy efficient than avg house today. (assume 5% of 2013 value in 2050) (Treehugger.com) Assume head towards 1000 kWh/hh by 2050. 1000
Commercial Energy Use Rates Assumptions Historical Data from USEIA, 2003 CA aims to reduce emissions by 40% ; CA Energy Commission(assume 60% 2015 value in 2030) Energy efficient buildings can be 70% more energy efficient than avg commercial building today today; USDOE (assume 30% of 2015 value in 2050)
Industrial Energy Use Rates Assumptions Historical Data from ??? CA aims to reduce emissions by 40% ; CA Energy Commission(assume 60% 2015 value in 2030) Energy efficient buildings can be 70% more energy efficient than avg commercial building today today; USDOE (assume 30% of 2015 value in 2050)