GIS in Evaluating Neighborhood Environment
190 likes | 423 Vues
GIS in Evaluating Neighborhood Environment. Prof. Yuji Murayama - Instructor Hou Hao – Teaching Assistant Division of Spatial Information Science University of Tsukuba. Importance of evaluating NE.

GIS in Evaluating Neighborhood Environment
E N D
Presentation Transcript
GIS in Evaluating Neighborhood Environment Prof. Yuji Murayama - Instructor HouHao– Teaching Assistant Division of Spatial Information Science University of Tsukuba
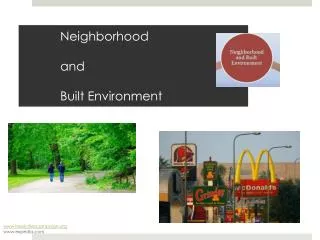
Importance of evaluating NE • public health community has become increasingly aware that the design ofthe built environment can have a major impact on the health of the public. • Good NE may expect more physical activity and healthier diets among persons in communities with convenient, safe walking paths. • Poor NE may be expected among residents of communities with high crime rates, few parks or walking paths. http://www.preventioninstitute.org/index.php?option=com_jlibrary&view=article&id=114&Itemid=127
Importance of evaluating NE “car-dependent neighborhood” is considered as “low-walkability community” which causes physical inactivity, increasing greenhouse gas emissions and Lack of social interactions(residents have little chance to encounter each other by occasion). car-dependent neighborhood Overweight and obesity Greenhouse gas emissions Lack of social interactions
Traditional way to evaluate NE • Neighborhood Environment Walkability Scale(NEWS) • The NEWS-A is an abbreviated version of the Neighborhood Environment Walkability Scale (NEWS). The abbreviated version was created in 2007 in an attempt to provide a more succinct and empirically-derived measure of various aspects of the built environment we purport to be related to walking. http://sallis.ucsd.edu/measure_news.html
Traditional way to evaluate NE • Neighborhood Quality of Life Study (NQLS) • NQLS was designed to identify environmental correlates of physical activity. This observational study of 2,200 adults aged 20-65 randomly selected from 32 neighborhoods in two regions of the U.S. developed new measures for studying NE associations with health behaviors. http://sallis.ucsd.edu/measure_nqls.html
GIS in evaluating NE Spatial Information • Capture • Storage • Manipulation • Analysis • Modelling • Retrieval • graphic presentation (Leslie, Eva, et al.)
GIS in evaluating NE Objective Spatial Data • Point: locations of facilities, trees, streetlights, etc. • Line: street network, land topography, etc. • Polygon: commercial land use, residential land use, institutional land use, etc. http://www.ncbi.nlm.nih.gov/pmc/articles/PMC1277960/
Attributes selection • Residential density • Street connectivity • Land use mix diversity • Aesthetics • Safety http://www.esri.com/news/arcuser/0112/modeling-walkability.html
Attributes selection • Residential density Higher density indicates higher accessibility to variety of complementary activities and more time consumed in driving and parking.
Attributes selection • Street connectivity • The density of intersections(3 or more unique intersecting streets). Higher connectivity indicates a greater variety of potential routes which means easier access to major roads and shorter times to destinations.
Attributes selection • Land use diversity (k is the category of land use; p is the proportion; N is the number of land use categories) Higher density indicates higher accessibility to variety of complementary activities and more time consumed in driving and parking.
Attributes selection • Aesthetics 1. Density of green land; 2. Number of landmarked buildings; 3. Percent of streets considered clean. …… (Lwin, KoKo, and Yuji Murayama)
Attributes selection • Safety(Traffic) • Slope(DEM); • Amount of traffic accidents; • Traffic slowing devices; …… http://www.cast.uark.edu/home/research/geomatics/lidar-and-hds.html
Attributes selection • Safety(Crime) • Amount of crimes; • Ratio of streets well lit at night. • Exhaust fumes from cars and buses …… http://www.bcs-gis.com/bcssubpage.aspx?page=cat http://www.bcs-gis.com/bcssubpage.aspx?page=cat
Result and discussion Traditional Method • Perceived result from questionnaire; • Data can be used directly; • Time and money consuming; • Difficult to understand the result; • Low efficiency; • Data quality cannot be promised.
Result and discussion GIS Method • Visible and easy to understand; • Objective data is trustful; • Save time and money ; • Many spatial analysis methods; • Lack of data for some attributes according to different area; • Need to process original data. (Duncan, Dustin T., et al.)
Conclusion http://www.preventioninstitute.org/index.php?option=com_jlibrary&view=article&id=114&Itemid=127
Conclusion(GIS in evaluating NE) There are many applications of GIS methods for guiding environmental and policy initiatives to promote NE. Increased computing capabilities, in concert with the availability of GIS-based land use and transportation data provide considerable opportunity to develop objective measures of NE that form independent predictors of human activity patterns. However, there are limitations in using this technology, especially for public health studies. Available data that can be used in GIS may be incomplete or inaccurate, and sometimes data are not available. Other types of limitations include the human and monetary resources required to incorporate GIS into a public health study.
Reference • Leslie, Eva, et al. "Walkability of local communities: using geographic information systems to objectively assess relevant environmental attributes. "Health& place 13.1 (2007): 111-122. • Lwin, KoKo, and Yuji Murayama. "Modelling of urban green space walkability: Eco-friendly walk score calculator." Computers, Environment and Urban Systems 35.5 (2011): 408-420. • Porter, Dwayne E., et al. "Considerations for using a geographic information system to assess environmental supports for physical activity." Preventing chronic disease 1.4 (2004). • Duncan, Dustin T., et al. "Validation of Walk Scores and Transit Scores for estimating neighborhood walkability and transit availability: a small-area analysis." GeoJournal 78.2 (2013): 407-416. • http://www.preventioninstitute.org/index.php?option=com_jlibrary&view=article&id=114&Itemid=127 • http://sallis.ucsd.edu/index.html • http://www.esri.com/news/arcuser/0112/modeling-walkability.html • http://www.cast.uark.edu/home/research/geomatics/lidar-and-hds.html