Download
1 / 9
90 likes | 324 Vues
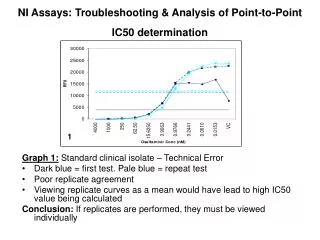
NI Assays: Troubleshooting & Analysis of Curve Fitting. Graph 1: Standard clinical isolate Good NA activity S shaped curve (observed points) IC50 in expected range for susceptible B Good fit of calculated curve to observed points Conclusion: VALID sensitive isolate.

E N D
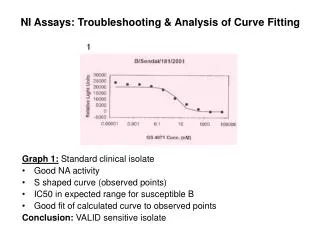
NI Assays: Troubleshooting & Analysis of Curve Fitting Graph 1:Standard clinical isolate • Good NA activity • S shaped curve (observed points) • IC50 in expected range for susceptible B • Good fit of calculated curve to observed points Conclusion: VALID sensitive isolate
NI Assays: Troubleshooting & Analysis of Curve Fitting Graph 2:Known resistant mutant • Low NA activity • Known resistant virus • High IC50 • S shaped curve, but displaced right because of drug inhibition • Good fit curve to observed points Conclusion: VALID resistant isolate
NI Assays: Troubleshooting & Analysis of Curve Fitting Graph 3:Clinical isolate with low IC50 • Low NA activity • Poor fit observed points to calculated curve • IC50 value low Conclusion: Probably isolate with normal IC50 → REPEAT
NI Assays: Troubleshooting & Analysis of Curve Fitting Graph 4:Clinical isolate with high IC50 • Low NA activity • Poor fit observed points to curve • IC50 displaced to right • High IC50 Conclusion: Probably resistant isolate REPEAT to check
NI Assays: Troubleshooting & Analysis of Curve Fitting Graph 5:Clinical isolate with low IC50 • Good NA activity • Poor fit observed values to curve especially at high drug concentrations • Non sigmoidal shape of observed curve • Low IC50 Conclusion: Probable error drug dilution for normal iC50 invalid → REPEAT
NI Assays: Troubleshooting & Analysis of Curve Fitting Graph 6:Clinical isolate with high IC50 • Low NA activity • Non sigmoidal observed points • High IC50 • Bimodal distribution observed points • Poor fit between observed points and curve Conclusion: Possible resistant but technical errors → REPEAT
NI Assays: Troubleshooting & Analysis of Curve Fitting Graph 7:Clinical isolate with normal IC50 • Good NA activity • Increase in drug concentration associated with increase NA activity (Biologically implausible) • Non sigmoidal observed points • Poor fit observed points and curve Conclusion: Invalid analysis but probably normal IC50. Technical errors → REPEAT
NI Assays: Troubleshooting & Analysis of Curve Fitting Graph 8:Clinical isolate with low IC50 • Low NA activity • Increase NA activity with drug concentration (Biologically implausible) • Bimodal distribution observed points • Poor fit observed points to curve • Low IC50 Conclusion: INVALID analysis → REPEAT as probably normal IC50
NI Assays: Troubleshooting & Analysis of Curve Fitting Graph 9:Clinical isolate with low IC50 • Good NA activity • NA activity increases with drug concentration • Bimodal distribution observed points • Poor fit curves and observed points • Low IC50 Conclusion: Invalid analysis → REPEAT as probably normal IC50