Map Basics
This guide covers the essential aspects of map creation and interpretation. It delves into the processes of simplification, classification, symbolization, and induction used by cartographers to create clear and informative maps. Readers will learn how to read maps effectively, including understanding scale, map keys, and compass roses. The guide explains latitude and longitude, map projections, and types of maps, including general-purpose and thematic maps. By combining theoretical knowledge with practical application, this resource is ideal for anyone looking to enhance their understanding of cartography.

Map Basics
E N D
Presentation Transcript
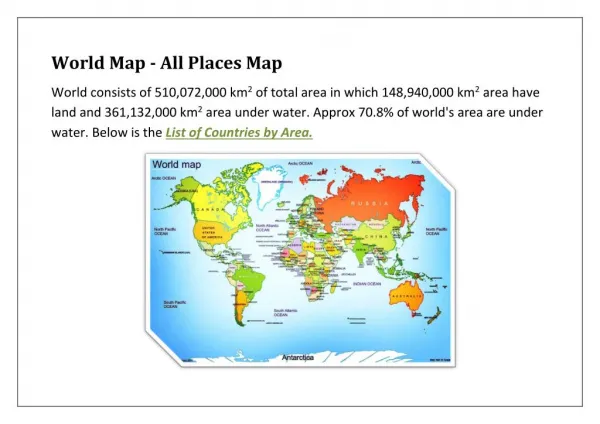
Maps • An attempt to portray things that are distributed across space.
Map Creation • Simplification – narrow down the criteria used in order to produce a clear and uncluttered view of whatever it is the cartographer wants the map to show. • Classification - how a cartographer categorizes the data he or she wants to show on a map. (example: precipitation) • Symbolization - a cartographer takes data and renders it into symbols such as shapes, colors and patterns to portray it on the map. • Induction – estimation – it’s not always possible to have data for everyplace on the map.
Reading a Map • Scale - the size of an area - relationship between the distances on the map and the actual distances on Earth • IMPORTANT – it can influence how things appear. • Map Scale portrayed in three ways. • Representative Fraction – ie: 1:100,000,000 • Written Statement / Verbal – one inch to 1,600 miles • Graphic Scale / Bar Scale - represents a segment of a ruler
Scale – Large or Small??? • Depends on how much detail is needed. • Large-scale Maps • Larger fraction • more detail • Smaller area • Small-scale Maps – smaller number, less detail . • Smaller fractions • Less detail • Larger area
How To Read a Map • Map Key – explains lines, symbols and colors on a map. • Dots: major cities or capitals • Compass Rose – cardinal directions
Latitude • Latitude – run west to east BUT measure north and south • parallel • Varying lengths • longest: the equator, • shortest: the poles • Thermal characteristics • Low latitudes – 0-30o – warm all year, no distinct seasonality • Mid latitudes – 30 – 600 – distinct winter and summer • High latitudes – 60 – 90o – cold almost all year, short “warm” season
Longitude • Longitude – run north and south – measure east to west • 00 – Prime Meridian – Greenwich, England • 1800 – international date line
Hemispheres • The Equator and and the Prime Meridian divide the earth into spheres. • The Equator - Northern and Southern Hemisphere • The Prime Meridian – Eastern and Western Hemisphere.
Map Projection • A 3D surface to a flat surface. • Distortion will occur in at least one area: • Area • Direction • Distance • Shape • no "best" projection.
Types of Map Projections • The Globe • Mercator (Transverse, Oblique and Space Oblique) • Cylindrical • Robinson • Conic (Albers Equal, Lambert Conformal, Equidistant (Simple Conic), Polyconic, Bipolar Oblique Conic Conformal • Sinusoidal Equal Area • Orthographic • Stereographic • Gnomonic • Azimuthal Equidistant • Lambert Azimuthal Equal Area
Types Map Projections • The Globe • True: Directions, Distances, Shapes and Areas • Great circles—The shortest distance between any two points on the surface of the Earth can be found quickly and easily along a great circle. • Disadvantages: • Even the largest globe has a very small scale and shows relatively little detail. • Costly to reproduce and update. • Difficult to carry around and bulky to store.
Types Map Projections • Mercator
Types of Map Projections • Robinson
Types of Map Projections • Conic (Simple)
How Maps are Made • Today satellites are used to make maps. • Geographic Information Systems (GIS) • Maps are produced faster and are easily changed.
General Purpose Maps • Maps that show a wide range of general information about an area. • Political – names and boundaries of cities and other human-made features of a place. • Physical - labels landforms and water features • Contour – shows elevation
Special Purpose Maps • Or Thematic Maps, which present specific kinds of information – themes or patterns. • Climate • Natural resources • Population density • Historic
![NCD by GC [a skeletal mind map for NCD basics]](https://cdn1.slideserve.com/3342082/ncd-by-gc-a-skeletal-mind-map-for-ncd-basics-dt.jpg)