Decision Support Systems in Integrated Crop Nutrient Management
690 likes | 1.15k Vues
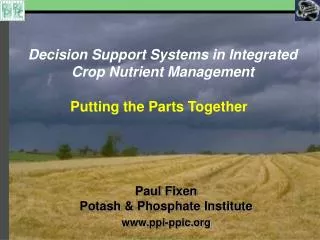
Decision Support Systems in Integrated Crop Nutrient Management. Putting the Parts Together. Paul Fixen Potash & Phosphate Institute www.ppi-ppic.org. Outline. Introduction Decision Support Systems Opportunity and Need for Improved Nutrient Management

Decision Support Systems in Integrated Crop Nutrient Management
E N D
Presentation Transcript
Decision Support Systems in Integrated Crop Nutrient Management Putting the Parts Together Paul Fixen Potash & Phosphate Institute www.ppi-ppic.org
Outline • Introduction • Decision Support Systems • Opportunity and Need for Improved Nutrient Management • Common Components of Decision Support Systems • Crop appearance • Crop nutrient removal • Soil testing, plant and grain analysis • Nutrient response measurement • Economic analysis • Environmental risk assessment • Integrating Nutrient Management • Conclusions
Much at stake At least 30-50% of crop yield is attributable to commercial fertilizer nutrients Stewart et al., 2005
Uncontrollable Controllable Pesticides Irrigation Fertilizer Tillage Others Lime Temperature Moisture Cultivar Cultural practices Light Soil Plant metabolism Plant composition Crop yield & quality A complex system involving uncertainty After Beaufils, 1973
Climate change Biodiversity Soil erosion Desertification Air quality Hypoxia Reactive N Ground water Rivers & streams Lakes Heightened need to get nutrient management right as yields climb and environmental concerns intensify
Science has never had a more complete set of “knowledge nuggets”. Industry has never had a more impressive set of technologies. The challenge: Delivering science and technology to the farm such that it can be integrated in support of decision making
Researchers, educators and crop advisers, have no impact on nutrient efficiency They impact grower decisions that impact nutrient efficiency
Decision support systems • Narrow definition: an interactive computer program that helps decision makers formulate alternatives, analyze their impacts, and select solutions • Broad definition: incorporates the narrow but includes other computer-based technologies that support decision making • Nutrient management examples: • See paper
Decision support systems - this paper • Even broader definition: previous plus the tools, computer-based or not, employed by growers and their advisers in making nutrient management decisions • These tools and how they are integrated locally to support decision making comprise the decision support system • The actual process used on farms today
Recommended rates Event probability Economic return Environmental impact Application timing Etc. Possible site factors Decision support Crop Soil Grower Nutrient inputs Water quality Climate Weather Technology Crop demand Soil supply Input efficiency Economics Environmental Grower/Owner Output Decision Action Outcome Feedback loop Real world nutrient management decisions – black box decision support
Real world nutrient management decisions – transparentbox decision support Recommended rates Event probability Economic return Environmental impact Application timing Etc. Possible site factors Decision support Crop Soil Grower Nutrient inputs Water quality Climate Weather Technology Crop demand Soil supply Input efficiency Economics Environmental Grower/Owner Output Decision Action Outcome Feedback loop
Open support systems • More demanding of the user • But more powerful • Framework for systematic improvement • Facilitate involvement of multiple parties • Incorporates local knowledge and expertise • More conducive to modifaction as science and technology evolves
Regional approach currently being implemented in U.S. Corn Belt for N rate guidelines for corn Site factors Decision support Calculation of avg. max. return to N (MRTN) based on state trials State Prev. crop Fertilizer cost Crop price Rates giving +/- $1 of MRTN Decision Action Assumes variation in crop N demand is countered by variation in soil N supply or efficiency such that rate remains constant … user cannot decouple (closed aspect) … reduces compatibility with other components of decision making Outcome At the same time in the region … Hybrid Maize is being launched After Sawyer & Nafziger, 2005
N fertilizer recovery in major cropping systems of the world An uncontrollable factor that markedly influences efficiency *Ladha et al., 2005; **Cassman et al., 2002
Short term vs long term goals • A challenge: avoid confusing true gains in system level efficiency with practices that simply borrow from future productivity • Case studies in Dobermann et al., 2005: • Soybeans in Hawaii (P) • Rice in Philippines (P&K) • Cotton in California (K) • Maize in Nebraska (N)
Response of annual and cumulative seed cotton yield to annual K application on a Vertisol Dobermann et al., 2005
N use efficiency in irrigated maize in Nebraska with recommended or intensive management Recommended: 7,500 p/ha; soil test-based fertilizer rates; 2 N splits. Intensive: 10,500 p/ha; higher fertilizer rates; 4 N splits + fall N on residue. System level efficiency Dobermann et al., 2005
Decision support systems should consider both short-term and long-term consequences
Donald Powell Head of Gulf Coast Recovery and Rebuilding Former FDIC Chair$62.3 Billion Federal Budget NPR Interview, 11/4/2005 “One of my major responsibilities is to see to that federal dollars are spent efficiently and effectively.”
Typical objectives of nutrient use • Provide economically optimum nourishment to crop • Minimize nutrient losses from the field • Contribute to system sustainability … soil fertility or other soil quality components The value of improving efficiency is dependent on the impact on effectiveness Can be very efficient … and totally ineffective (Low P rate at a low soil P test)
Amount broadcastinitially, lb P2O5/A Olsen soil testat end of 5-yr: 42 15 ppm 160 40 80 8 ppm 38 0 36 5 ppm Wheat yield, bu/A 34 32 Highest P efficiency (about 30% recovery ) … but not where you want to be 30 28 0 10 20 30 40 Annual seed-placed P2O5, lb/A High efficiency is not enough Wager et al., 1986
Nutrient use efficiency (NUE) vs. land use efficiency (LUE) Dibb, 2000
Ecological Intensification of Agriculture(Simultaneous pursuit of higher LUE & NUE) “The intensification of production systems to satisfy the anticipated increase in food demand while meeting acceptable standards of environmental quality” Success will require rigorous nutrient management decision support Cassman, 1999 Cassman, 1999
U.S. Maize 59 43 39% increase in N efficiency 12% increase in fertilizer N per ha 40% increase in corn yields Since 1975: Can NUE and productivity be increased simultaneously? Updated from Fixen & West, 2002
Common Components of Decision Support Systems • Crop appearance • Crop nutrient removal • Soil testing, plant and grain analysis • Nutrient response measurement • Economic analysis • Environmental risk assessment • Integrating Nutrient Management
Crop appearance – low tech approach. Qualitative Semi-quantitative Leaf color charts
Integrated Sensing & Application Crop appearance – high tech (before yield loss) RT200 Variable Rate Applicator with GreenSeeker Individual Sensors Six individual sensor readings are used to calculate the crops mean NDVI for the width of the applicator and the N rate is automatically adjusted Lafond, 2005
Added 15% to N recovery in Oklahoma winter wheat studies • Growing in popularity in US Great Plains Hand-held unit
Crop nutrient removal • Provides a basic reference point • Most effective when combined with soil test information • An old but still underutilized concept • Example – US Corn Belt – see paper
60 50 1997 40 30 20 10 0 60 50 40 1999 Relative frequency (%) 30 20 10 0 60 50 40 2001 30 20 10 0 100 150 200 250 300 Ammonium acetate K categoryupper limit (ppm) Indiana precision corn field How have soil test levels been changing over time • Years 1 & 2: Number of categories did not change • Year 3: No samples in higher categories • Category with most samples moved downward: • 1997: 176 – 200 ppm • 1999: 126 – 150 ppm • 2001: 101 – 125 ppm Murrell et al., 2002
400 32.0 350 28.0 300 24.0 250 20.0 CV (%) Ammonium acetate K (ppm) 200 16.0 150 12.0 100 8.0 50 4.0 Median CV 0 0.0 1997 1997 1998 1998 1999 1999 2000 2000 2001 2001 2002 Year What has been happening to soil tests and variability? • K fertility becoming less variable but is drifting downward to yield-limiting levels • Reinforces the message of regional removal data Murrell et al., 2002
Crop Nutrient Removal – low tech application • Charts showing • nutrient removal • In adviser’s pocket • Wall poster
A higher tech approach to determining crop removal … PKalc. What are the nutrient balances for a field? Downloadable with documentation at www.ppi-ppic.org\toolbox
Soil testing • The traditional foundation in developed countries for over half a century • A powerful decision aid but with limitations • Not available in all regions • Laboratory inaccessibility • Lack of relevant calibration research • Insufficient cash flow on farm or in village
Soil testing: the calibration problem in North America • Soil testing began in mid 20th century • Extensive calibration research lead to recommendations usually based on soil level and expected yield • Common belief … calibration research no longer needed • Soil testing remains an empirical approach - system changes can alter interpetation • Field: crop genetics, tillage, rotations, populations, slow soil profile changes, other cultural practices • Laboratory procedural changes • Soil sampling changes
K recommended or used in Iowa (1000 tons K2O) Old recs 260 2001-2 use 440 New recs 572 (30% incr) 2004 use 606 (39% incr) 36 60 Recommendation Changes in Iowa • Recommendations doubled because of new calibration • Farmers responded to the change Number in red is % medium or below. Mallarino et al., 2002
Soil testing: interpretation within decision support systems • Appropriate calibration in essential • Appropriate interpretation is as well • Replacing general assumptions with site or grower-specific information • Examples of relevant information: • Yield potential and net crop value • Fertilizer costs • Factors influencing plant fertilizer recovery • Land tenure • Minimum acceptable return on investment
Workshop: International Symposium on Soil Testing and Plant Analysis (Olympia, WA) • Workshop participants were soil testing professionals from 11 countries • Divided into two classes of 20 each • Each class divided into 4 groups of 5 with each group given information on a specific farmer • All groups given same calibration data, uptake data, and initial soil test level • Asked for the P rate to apply in first year and for long-term target soil test level
Comparison of intuitively derived P recommendations to PKMAN output Computer program generated recommendations similar to the soil testing professionals Fixen, 1994
Within field variability …not a new concept but one with increased importance • “There are dozens of soil types, and also many man-made variations within each soil type.” • “Present needs within a soil type depend so much on what has or has not been done before.” Johnson, 1952
Within field variability had new meaning once the technology existed to manage it A critical component of modern decision support … paper by Rosie Bryson
Plant and grain analysis Role could increase in an information-rich support system
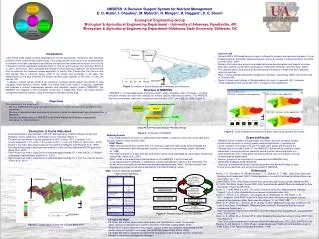
Maps of reference grain protein and AccuHarvest protein for hard red spring wheat in northern Montana, U.S. Calibrated for wheat, barley, corn, soybean Long and Rosenthal, 2005
Grain protein could become important feedback Possible site factors Decision support Crop Soil Grower Nutrient inputs Water quality Climate Weather Technology Crop demand Soil supply Input efficiency Economics Environmental Grower/Owner Output Decision Action Outcome Feedback loop PROTEIN
Nutrient response measurement Omission plots On-farm research
Nutrient response measurement – omission plots Used to determine indigenous nutrient supply of a specific nutrient when others are non-limiting A component in NuDSS N omission plot in rice field Witt and Dobermann, 2002
Flow chart of NuDSS for irrigated rice Updated from Witt and Dobermann, 2004
350’ Nutrient response measurement - on-farm research Yield monitors, GPS, GIS, software … expand the potential 70’ Consider the power of combining, omission plots, yield monitors, and grain protein sensing Technical manuals available Example: www.ppi-ppic.org\toolbox
Economic analysis • Budget analysis software • Example – Crop Budgeting Tool (U. of Illinois) • Connects yield levels and input decisions to profit and unit costs of production • Valuable planning tool • Illustrates the value of nutrient management in farm profitability