Hypothesis Testing I, The One-Sample Case
Hypothesis Testing I, The One-Sample Case. Hypothesis Testing. Also called significance testing Need to decide if a sample is like a population for a particular variable Will be trying to find if the sample is different from the population


Hypothesis Testing I, The One-Sample Case
E N D
Presentation Transcript
Hypothesis Testing • Also called significance testing • Need to decide if a sample is like a population for a particular variable • Will be trying to find if the sample is different from the population • We want to find if the difference between the sample and the population is real or is due to randomchance • We know the statistics from the subgroup, and we know the parameters from the larger group of all people—we want to compare the two groups
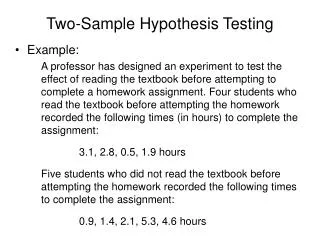
An Overview of Hypothesis Testing • You are hired to evaluate a treatment program for alcoholics • You have a group of treated alcoholics (N=127) • The treated alcoholics have lower absentee rates than the community as a whole
Two Possible Explanations for the Difference • The Research Hypothesis • Alcoholics treated in the program really do have lower absentee rates • Another way to say it is “the difference is statistically significant” • The difference did not occur by random chance • The Null Hypothesis • Symbolically stated as: • Xbar = µ = 7.2 days per year
Decision Rule • Need to add an objective decision rule in advance • If the odds of getting the observed difference (the difference between the sample mean and the mean of the population) are less than 0.05 (5 out of 100, or 5 percent, or 20 to 1), will say that the null hypothesis is not supported • We always bet against rare events
Sampling Distribution • We may assume that the sampling distribution is normal in shape • That it has a mean of 7.2 • Has a standard deviation of 1.43/√127 • We know that the sample outcome of Xbar of 6.8 is one of thousands of possible sample outcomes
Decision Rule Rephrased • Any sample outcome falling in the lined areas in Figure 8.2, by definition has a probability of occurrence of less than 0.05 • That outcome would be a rare event and would cause us to reject the null hypothesis as untrue • The null hypothesis • says that there is NO real difference between your sample and the population (the observed difference is due to random chance)
Last Step • To translate the sample outcome into a Z score so we can see where it falls on the curve • The formula for a Z score:
So, to find the Z score for any sample mean, subtract the mean of the sampling distribution from the sample mean and divide by the standard deviation of the sampling distribution • The Z score for the example in the book is -3.15 • The sample outcome does fall in the shaded area • You reject the null hypothesis • You reject the idea that nothing is going on • You are saying that treated alcoholics ARE significantly different from the community as a whole on the trait of absenteeism
Step 1 • Making assumptions • Three necessary assumptions • Assume random sampling • Assume that the level of measurement is interval-ratio • It is the only level where the mean should be computed • Assume the sampling distribution is normal
Step 2 • Stating the null hypothesis • You know there is a difference between your subgroup and the larger population • You know the parameters for the population • You know the statistics for your subgroup (sample) • There are two possible explanations for the difference • The research hypothesis is that there is a realdifference between the subgroup and the population • The difference is statistically significant
Step 2, Continued • The null hypothesis is that the observed difference is due only to chance • There is no real difference between your subgroup and the population • The null hypothesis • The hypothesis that nothing is going on • Could call it the nothing hypothesis • It is a statement of no difference
Step 3 • Selecting the sampling distribution and establishing the critical region • If you are working with the mean of the sample, you select the sampling distribution of sample means as your sampling distribution • The critical region consists of the areas under the sampling distribution that include all unlikely sample outcomes • In English, we need to pick a confidence level • Will usually choose the 95% confidence level, though computer programs will state the actual confidence level at exactly the area where it falls on the Z distribution • So, plus or minus 1.96 becomes Z (critical) • If the test statistic falls in the critical region, we may conclude that the null hypothesis can be rejected
Step 4 • Computing the test statistic • You know the mean of the sample • You need to convert that mean into a Z score, which is called “computing the test statistic” • The Z score corresponding to the sample mean is called Z (obtained) • The Z formula is in your book • Z = the mean of the sample minus the mean of the sampling distribution of sample means (which equals the mean of the population) divided by the standard deviation of the population divided by the square root of N (the size of the sample, not the size of the population)
Step 5 • Making a decision • If the test statistic falls in the critical region, our decision will be to reject the null hypothesis • If the test statistic does not fall in the critical region, we fail to reject the null hypothesis • Therefore, if Z (obtained) is greater than or less than Z (critical), we reject the null hypothesis • If we reject the null hypothesis, the difference observed between the sample and the population was unlikely to have occurred by chance alone
One-Tailed Tests • You can use a one-tailed test in two cases • The direction of the difference can be confidently predicted • The researcher is concerned only with sample outcomes that fall in one tail of the sampling distribution • Usually for program evaluation (e.g., sex education to reduce teenage pregnancy) • If you predict a direction, you use a one-tailed test • Example, your research hypothesis states that you believe that sex education classes will reduce the number of pregnancies among teenagers, you would use a one-tailed test • You are only interested in the lower end—that your sample has a mean lessthan the population • Now, you do not divide alpha by 2 to find the area at both ends, so you have the entire 5% at only one end, with 95% on the other side • Therefore, Z (critical) becomes -1.65 for an example that predicts that the sample mean will be significantly lower than the population mean • Given the same alpha level, the one-tailed test makes it more likely that the null hypothesis will be rejected
Type I, or Alpha Error • Type I or Alpha Error • The confidence levels of 90%, 95%, or 99% are each associated with corresponding alpha levels of .10, or .05, or .01 • This is the probability that if the test statistic falls in the critical region, and we reject the null hypothesis, we made a mistake • You reject the null, but you are wrong, so need low alphas to avoid Type I errors • This can be defined as the rejection of a null hypothesis that is in fact true (falsely rejecting a true null) • To minimize this type of error, very small alphas should be used
Type II, or Beta Error • As the critical region decreases in size (as alpha levels decrease) the non-critical region becomes larger • The lower the alpha level, the less likely the sample outcome will fall in the critical region • You fail to reject the null, when you should have rejected it • You say nothing is going on, but something really is • Raises the possibility of a Type II error, which is: failing to reject a null that is in fact false • With lower alphas, the chances of a Type I error decreases, and the chances of a Type II error increases • Therefore, these errors are inversely related
Small Sample Size • If the sample size is less than 100, will use the t distribution in Appendix B in the back of your book • The t distribution, compared to the Z distribution, is flatter for small sample sizes but increasingly like the Z distributionas N increases • As N increases, the sample standard deviation becomes a better estimator of the population standard deviation
The t Table • Differs from the Z table in several ways • Alpha levels are across the top in two rows, one for one-tailed tests and one for two-tailed tests • To use the table, select the alpha level in the appropriate row and column • Second, there is a column at the left labeled df for “degrees of freedom” • For a single sample mean, the degrees of freedom are equal to N-1 • The third difference is that the entries in the table are the actual critical values (like Z values, but now called t values), called t (critical) • These mark the beginnings of the critical regions and not areas under the sampling distribution
Additional Features of the t Distribution • The t (critical) is larger in value than the comparable Z (critical) • Example, if N = 30, t (critical) at the .05 level for a two-tailed test is plus or minus 2.045, and it was 1.96 for Z (critical) • When you use the t distribution, the critical regions will begin farther away from the mean of the sampling distribution • So, the null hypothesis will be harder to reject (since the critical region is smaller)
Additional Features • Also, the smaller the sample size (the lower the degrees of freedom), the larger the value of t (obtained) necessary for a rejection of the null hypothesis • So harder to reject the null hypothesis with smaller sample sizes • As sample size increases, the t distribution begins to resemble the Z distribution, until above 120, the two are essentially identical • You can use the Z distribution for small sample sizes if the standard deviation of the population is known
Differences from Hypothesis Testing of Sample Means • In Step 1, we assume only nominal level of measurement when working with sample proportions • In Step 2, the symbols used to state the null hypothesis are different, even though the null is still a statement of “no difference”