Download
1 / 10
270 likes | 1.1k Vues
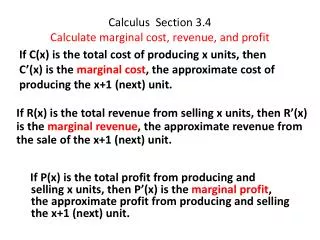
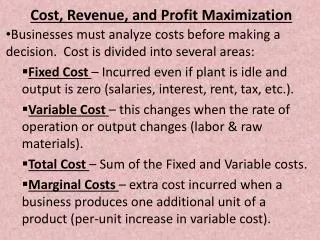
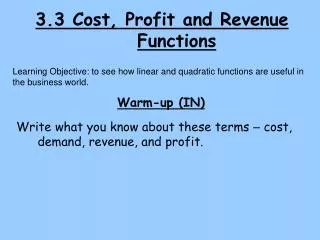
3.3 Cost, Profit and Revenue Functions. Learning Objective: to see how linear and quadratic functions are useful in the business world. Warm-up (IN). Write what you know about these terms – cost, demand, revenue, and profit. Notes!. Cost (C). Revenue (R). break even. If C=R. R>C.

E N D
3.3 Cost, Profit and Revenue Functions Learning Objective: to see how linear and quadratic functions are useful in the business world. Warm-up (IN) Write what you know about these terms – cost, demand, revenue, and profit.
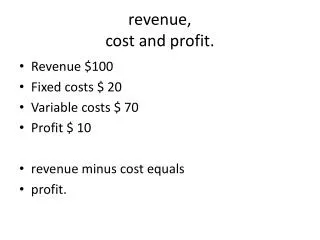
Notes! Cost (C) Revenue (R) break even If C=R R>C make a profit R<C loss of money 2 types of costs rent, insurance, etc. Fixed - Materials, wages, etc. Variable - Dependent on # of items made or hours worked
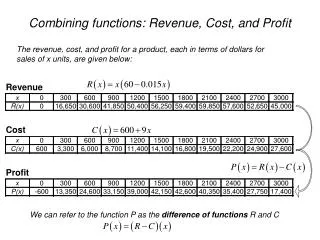
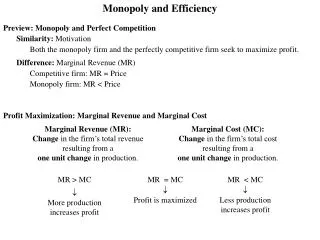
C= fixed costs + variable costs Cost Function - linear Price-Demand Function - m and n are constants (depending on the problem) linear x is the # of items that can be sold at $p per item Revenue Function - # of items sold*price per item quadratic or Profit Function - or quadratic
Ex 1 - Price-Demand data from a manufacturer of cameras: P - Wholesale price per camera x - millions of cameras sold * note as price goes down, # sold goes up a) Plot the data in the table and find the price-demand function. What is the domain?
b) What is the company's Revenue function for this camera? What is the domain of the function? c) Complete the table, computing revenues to the nearest million dollars in millions of $s in millions 89.79 1 3 239.61 6 389.94 9 450.99 422.76 12 305.25 15
d) Graph the revenue function and change the window appropriately. Sketch the function below. What kind of graph is it? e) What is the max revenue to the nearest $1,000? For what output of cameras (nearest thousand)? x=9.55 y=452.5 9,550,000 cameras $452,500,000 revenue
f) What is the wholesale price per camera to nearest dollar to produce the max revenue? Use the # of cameras that maximizes revenue for x! per camera g) Given the cost data below, find the cost function for manufacturing the cameras.
h) Find the company's profit function. Graph and find the max profit and output. Max output Max profit 7.5 million cameras $128.27 million
i) Find the wholesale price for cameras to produce max profit. Use the # of cameras that maximizes profit for x! per camera j) Find where the company would break even, run at loss, or have a profit. and break even loss and Profit
Out – Summary – Don’t forget about POW!! HW –