Download
1 / 19
220 likes | 468 Vues
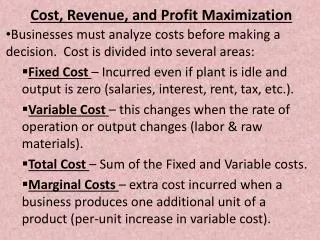
Revenue, Expense and Profit. Expenses. Expenses are money that a company must pay to keep the business operating. Expenses fall into 2 major categories. Fixed Expenses are costs that do not depend on the quantity of goods that are sold.

E N D
Expenses • Expenses are money that a company must pay to keep the business operating. Expenses fall into 2 major categories. • Fixed Expenses are costs that do not depend on the quantity of goods that are sold. • For example – rent, manager salaries, insurance, advertising, etc… • You have to pay these expenses whether or not you sell anything. • Variable expenses are costs that do fluctuate with sales and production. • For example – labor costs, material costs, packaging, etc… • Variable Costs = Unit Cost x Quantity V = cq • Total Expenses = Fixed Expenses + Variable Expenses • E = F+V • A company sells candles. Each candle costs $1 to make. The fixed costs are $1,000 per month. • What are the monthly expenses if the company makes 500 candles? • E = F + cq E = $1,000 + $1 x 500 E = $1,500
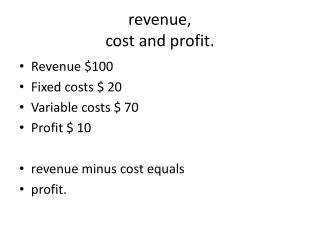
Revenue and Profit • The role of a company or corporation is to make money for its owners. • Revenue is the money a company collects from its customers. • Revenue = Price x Quantity R = pq • Profit is the money a company earns after paying its expenses. • Profit = Revenue – Expenses P = R-E • What is its revenue and profit if the candle company sells its 500 candles for $3.50 each? • Revenue = $3.50 x 500 Revenue = $1,750 • Profit = $1,750 - $1,500 Profit = $250 • Revenue and Profit are often confused. • If someone asks how much you “make”, this is typically referring to profit. • Revenue is often called “Sales”. • This company had revenue of $1,750, but they had profit of $250. • This company earned $250. This is how much the owners “made”.
Ways To Calculate Profit • Profit = Revenue – Expense P = R-E • Other Profit Equations P = pq - E P = pq – (F + V) P = pq – (F +cq) P = pq – F – cq P = (p-c)q – F This could still be arranged in many more ways. Different equations are useful based on the information given and the information you are looking for.
Average Unit Cost • The Average Unit Cost is just the total Expenses divided by the quantity. • Average Unit Cost = E/q • Average Unit Cost = (F + cq) / q • Average Unit Cost = c + F/q • Example • Fixed Costs of $1000 • Variable Unit Cost of $0.10 • Because the fixed costs get spread out over more units, the average cost typically decreases as more units are produced and sold.
Break-Even Point • The break-even point is the quantity of goods sold that makes the revenue equal to expenses. It is the point at which profit is exactly 0. • When graphing revenue and expenses it is the point where the two lines meet. • You can find the break-even point algebraically by setting the expense function equal to the revenue function. • R = pq E = F + cq • pq = F + cq • pq – cq = F • (p-c)q = F • q = F / (p-c) This bottom equation is a quick way to get the breakeven quantity
Break-even Example • A company has $5000 in fixed costs • They sell their product for $10 • They have variable unit cost of $3. • What is the breakeven? • Breakeven = 5000 / (10-3) = ~714 units • Revenue = 714 x $10 • Expense = 714 x $3 + $5000 • Both equal $7140
Breakeven Graph • Breakeven is where the lines cross • Fixed Cost is where the expense line meets the Y axis
Parabolic Revenue Functions • In reality, many companies can not just sell everything they make. • If they want to sell more, they must lower the price. • If they raise the price, they will sell less. • This results in a situation where the revenue function is not a straight line, but a parabola. • Price (p) is now the independent variable instead of quantity. • R=pq q = -mp + b • m = reduced quantity for every $1 increase in price • b = amount one could give away for free • So … R = p (-mp + b) = -mp2 + bp
Parabolic Revenue Function Example • Stan has a hotdog cart. He is deciding what to sell his hotdogs for. • He knows even if he gives them away for free, he could get rid of 1,000 hotdogs per day. • For every $1 increase in price, he would lose 300 customers. • The quantity Stan could sell is … q= -300p + 1000 • This is known as the demand function. • The Revenue equation is R=pq , so… • R = p (-300p + 1000) • R = - 300p2 + 1000p
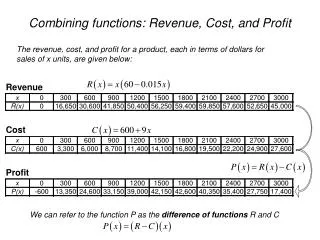
Parabolic Example • Stan’s revenue equation is R = - 300p2 + 1000p • Stan has $100 in fixed expenses and each hotdog costs $0.50 in variable costs. • E = $0.50q + 100 • E = $0.50 (-300p + 1000) +100 = -150p + 600 • The profit equation is P = R-E Profit = (- 300p2 + 1000p) – (-150p + 600) Profit = - 300p2+1150p – 600 • This leaves us with 3 equations to graph… • Revenue, Expense and Profit
You can see from the graph that the max profit is right around $500, when the price is $2.
Finding Max Profit • The graph gives a good representation of the problem, but you can’t see the exact answer. • To graph parabolas, it is fastest to find the “axis of symmetry” first. • Y = ax2 + bx + c • Axis of symmetry is … x = -b/2a • Profit = - 300p2 +1150p – 600 • X = -1150 / 2(-300) = 1.92 • This means the maximum profit would be when the price is $1.92 • The actual max profit is = -300(1.92)2 + 1150 (1.92) – 600 • Max Profit = -1106 + 2208 – 600 = 502
Finding Break-even • Probably the best way to find the break-even point is to use the quadratic formula on the profit equation. • Y = ax2 + bx + c • Profit = - 300p2 +1150p – 600 • Breakeven = $0.62 and $3.21
Equations • Revenue = Price x Quantity R=pq • Expense = Fixed Cost + Variable Cost E=F+V E = F + cq • Variable Cost = Unit Variable Cost x Quantity V = cq • Profit = Revenue – Expense P = R-E • Other Profit Equations P = pq - E P = pq – (F + V) P = pq – (F +cq) P = pq – F – cq P = (p-c)q – F • Breakeven point – • Profit = 0, Revenue = Expense, q = F/(p-c) • Average Unit Cost • Total Cost / Quantity E/q, (F+cq)/q Axis of Symmetry = -b/2a
Practice Review Problems • Pete sells plums for $0.75. They cost him $0.20 each. He has fixed costs of $1,000. • What is his profit if he sells 2,000 plums? • What is his average unit cost? • What is his breakeven quantity and revenue? • Steve sells six hundred seventy six sea shells by the sea shore. Each shell can be sold for $2. He has fixed costs of $500 and earns profit of $700. • How much must he pay to acquire each shell? • What is the average cost of each shell? • What is Steve’s breakeven point?
Pete’s Plums • P = 2000 x $0.75 - $1000 – 2000 x $0.20 • P = 1500 – 1000 – 400 = $100 • Average Cost = $1400/2000 = $0.70 • BE quantity = $1000/($0.75 - $0.20) • BE quantity = 1818 • BE Revenue = 1818 x $0.75 = $1363.63
Steve’s Shells • $700 = ($2 - c) x 676 - $500 • $1200 = ($2 –c )x 676 • $1.77 = $2 – c • -$0.23 = -c c = $0.23 • Average cost = $0.23 + $500/676 = $0.97 • BE quantity = $500/($2 - $0.23) = 282 shells