Download
1 / 55
550 likes | 714 Vues
Creating a Longitudinal Continuum of Access to Care. Anne Willis, MA Director, Center for the Advancement of Cancer Survivorship, Navigation and Policy Heather Kapp, LICSW, MPH Director, Access and Quality George Washington Cancer Institute. Objectives.

E N D
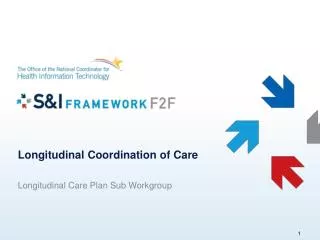
Creating a Longitudinal Continuum of Access to Care Anne Willis, MA Director, Center for the Advancement of Cancer Survivorship, Navigation and Policy Heather Kapp, LICSW, MPH Director, Access and Quality George Washington Cancer Institute
Objectives • Discuss longitudinal navigation models • Describe the DC Citywide Patient Navigation Network as a model of a longitudinal continuum of access to care • Identify different navigation functions across types of navigators • Discuss the role of quality improvement and patient navigation
GW Cancer Institute • Mission • Ensure access to quality, patient-centered care across the cancer continuum through community engagement, patient and family empowerment, health care professional education, policy advocacy and collaborative multi-disciplinary research. • Center for the Advancement of Cancer Survivorship, Navigation and Policy
Colorado Patient Navigation Model Source: patientnavigatortraining.org
Network Conception • National Cancer Institute Patient Navigation Research Program (PNRP) funded nine (9) site demonstration projects & tested: • Effectiveness of patient navigation from screening to time of diagnosis and treatment • Impact on patient satisfaction • Cost-effectiveness of patient navigation programs
Results from DC PNRP • 2,601 women • 1,047 navigated • 1,554 records-based non-navigated • 2006-2010 at nine hospitals/clinics in DC • Navigated women reached diagnostic resolution for breast cancer 17 days sooner than non-navigated women • For those requiring biopsy, the difference between navigated versus non-navigated women was nearly 31 days Source: Hoffman HJ, LaVerda NL, Young HA, Levine PH, Alexander LM, Brem R, et al. Patient navigation significantly reduces delays in breast cancer diagnosis in the District of Columbia. Cancer Epidemiol Biomarkers Prev 2012.
Birth of DC Network • Expand navigation beyond breast cancer • Expand beyond 9 sites of PNRP to 40 clinical and community sites • Focus on service delivery rather than research • Utilize data to inform cancer control planning
Citywide Patient Navigation Network (CPNN) Vision • Ensure every patient in the DC region has access to cancer care across the continuum regardless of race, ethnicity, sexual preference, socioeconomic status or geographic residency • Improve cancer outcomes among DC patients • Improve access to care across the cancer continuum • Eliminate barriers to care
CPNN Goals • Help patients overcome barriers to care, with special attention to vulnerable and minority populations. • Navigators help patients obtain timely, coordinated cancer care, including screening and diagnostic services, treatment, survivorship and end‐of‐life care.
Site Selection • GWCI serves as the central coordinator of CPNN which is currently comprised of 36 navigators stationed at primary care, tertiary care and community-based organizations. • Several of these organizations have multiple clinics served. • One navigator also navigates for the Department of Health's Project Wish, which provides qualified women with breast and cervical cancer screening at no cost.
Active Sites • Capital City Area Health Education Center • DC Primary Care Association • Howard University Cancer Center • Whitman Walker • Nueva Vida • The Smith Center for Healing and the Arts • MedStar Washington Hospital Center • Providence Hospital • Capital Breast Care Center • African Woman’s Cancer Awareness Association • Community of Hope
Role of CPNN Navigators • Maintain communication with patients, survivors, families, and the health care providers • Ensure appropriate records and referrals are available at scheduled appointments • Arrange for language, financial, transportation, child/elder care, insurance, medication, home health care and other forms of support • Connect patients to resources and support services • Help patients learn to navigate the health care system
CPNN Evaluation Plan • Demographic data • Barriers addressed • Resources utilized • Connectivity of network
Year 2 Accomplishments • CPNN grant extended to Year Two. • Goal: navigate at least 1,525 patients and educate 4,301 individuals. • Total: 2,840 patients were navigated and 8,880 outreach contacts were made.
Year 3 • Focus on • Sustainability • Quality improvements • Improved data systems • To date, 1,800 individuals reached and 1,368 barriers to care have been removed.
CPNN Summary Since 2010 • Provided assistance to 6,556 individuals and impacted 19,087 through education and outreach. • Removed 24,846 barriers to care. • Nearly 25.79% patients were uninsured. • Top barriers were social/practical support (16.02%), financial barriers (15.74%), system problems with scheduling care (13.78%) and language barriers (11.16%).
CPNN Summary Since 2010 • Approximately 85% of individuals served are racial or ethnic minorities, including over 50% African American and nearly 32% Latino. • Patients served include the following top cancer diagnoses: breast (68%), cervical (7%), prostate (5.52%), and colorectal (4.55%) and lung (2.58%). • Patients were 83% female, 14% male, and 0.1% transgender with 48% heterosexual and 1.5% LGBT (50.5% did not report sexual orientation).
CPNN Summary Since 2010 • About a third of individuals were age 50-64, with approximately 20% age 40-49 and about 13% over the age of 65. Approximately a quarter of individuals did not report age. • Almost half of individuals served live in the District of Columbia, with 29% from Maryland and 18% from Virginia. • Over 1,000 were from Wards 7 and 8, the most poverty-stricken Wards in DC.
Greatest Successes: Feedback from Site Visits • Improved patient access to services across cancer continuum • Greater number of patients served and with more comprehensive services • Network serves as forum for discussion of challenges and problem-solving • Social and practical barriers resolved to improve adherence to treatment • Network addressed system fragmentation to avoid loss to follow up. • Information and resource sharing • Relationships developed with other navigators make process of referrals to other services seamless
Greatest Opportunities: Feedback from Site Visits • Promote engagement/networking among the navigators • Programs need to be flexible and able to expand or contract given the variability of grant funding • Training is critical to enable navigators to successfully work with patients • Continue to provide updates to resources and support groups • Dedicate funds to support patient transportation to and from treatment • Most of the community organizations that navigators referred to were not in the network
Lessons Learned:Feedback from Site Visits • Breadth of network • Promoting the program to raise awareness in the community about patient navigation and CPNN • Developing standards for patient navigators to ensure a high quality service • Collecting data and information to support sustainability from the beginning • Simplifying paperwork • Addressing patient language issues
Challenges and Solutions • Multiple changes to evaluation methods • Staff turnover • Program coordinator is a core coordination node, providing monthly networking/training meetings and process improvements responsive to partner feedback. Keeps the network engaged! • Funding and sustainability, patient navigation is not a billable service • Ensuring a quality standard for navigation across the network
Future Directions • Pilot database to improve outcomes tracking • Involve navigators in the metrics selection • Collect ROI data to show program value • Collect health equity data • Provide weekly resource newsletter to help sites better organize updates and resources, create blog? • Conduct focus groups with navigators • Revisit training preferences: • Live? Webinar? • Invite community organizations to participate • Provide individualized technical assistance to help sites show value
Summary • Navigation continues to show value as an important strategy for patient‐centered care. • CPNN provides a critical safety net for cancer patients in the DC area that can be replicated in other urban areas and for other diseases. • CPNN has many accomplishments and successes to carry forward.
Role Delineation Project Overview • Distinguish roles across CHWs, patient navigators and nurse and social worker patient navigators • Methods • Review of literature, training curricula, grey literature • Development of a framework • Expert consensus • National survey
Existing Competencies • CHW Competencies • MA, MN, NM, NY, OH, TX • Oncology Nursing Society • Patient navigator training programs at GWCI, University of Colorado, PNRP, Freeman
Q/PI Tools • Understanding the problem: • Patient Flow/Process Map • Fishbone Diagram • Pareto Chart • Planning for change: • PDCA (PDSA) • Six Sigma DMAIC
Q/PI Tools: Patient Flow • How many times is the patient passed from one person to another (hand-off)? • Where are delays, queues and waiting built into the process? • Where are the bottlenecks? • What are the longest delays? • What is the approximate time taken for each step (task time)? • What is the approximate time between each step (wait time)? • What is the approximate time between the first and last step? • Wow many steps are there for the patient? • How many steps add no value for the patient? • Are there things that are done more than once? • Look for “re-work loops” where activities are taken to correct situations that could be avoided is work being batched? • Where are the problems for the patients? • At each step is the action being undertaken by the most appropriate staff member? • Where are the problems for staff? Understanding the Patient Journey-Process Mapping http://www.scotland.gov.uk/Resource/Doc/141079/0036023.pdf
Q/PI Tools: Patient Flow How/where are patients screened? What happens when there is an abnormal finding? How are patients notified? How do they get to your institution? What happens after treatment begins? Are psychosocial needs assessed and resources made available? How are medical, psychosocial and practical needs managed and by whom? 3. Treatment 1. Screening 4. Post-treatment 2. Diagnosis What happens during the diagnosis meeting? How are treatment decisions made? What do patients do when and after treatment options are discussed? What happens when treatment ends? Is there communication with the primary care provider? How are medical, psychosocial, and practical needs managed and by whom?
Q/PI Tools: Patient Flow Blasberg. ACCC Cancer Care Patient Navigation: A Call to Action http://accc-cancer.org/education/pdf/PN2009/s15.pdf
Q/PI Tools: Patient Flow Sandoval et al. 2013. J of the Society for Healthcare Improvement Professionals.
Q/PI Tools: Fishbone Diagram • Problem • Categories of problems • Causes of problems Why? Why? Why? Why? Why?
Q/PI Tools: Fishbone Diagram Blasberg. ACCC Cancer Care Patient Navigation: A Call to Action http://accc-cancer.org/education/pdf/PN2009/s15.pdf
Q/PI Tools: Pareto Chart • When analyzing data about the frequency of problems or causes in a process. • When there are many problems or causes and you want to focus on the most significant. • When analyzing broad causes by looking at their specific components. • When communicating with others about your data.
Q/PI Tools: PDCA • Plan • Plan a change • Do • Test/pilot change • Check/Study • Analyze results • Act • Make a decision: expand, alter, abandon • CAP-Do