Correlation
Correlation. CJ 526 Statistical Analysis in Criminal Justice. Correlation and Prediction. If a relationship exists between two variables Usually used with ex post facto designed No manipulation of an IV by the researcher. Requirements for Correlation.


Correlation
E N D
Presentation Transcript
Correlation CJ 526 Statistical Analysis in Criminal Justice
Correlation and Prediction • If a relationship exists between two variables • Usually used with ex post facto designed • No manipulation of an IV by the researcher
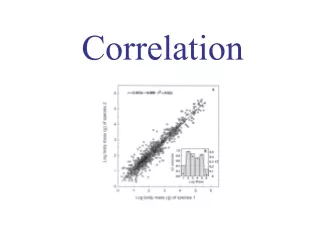
Requirements for Correlation • Requires two scores for each unit of analysis: • X • Y Represented by a scatterplot Graphical representation of relationship between the two variables
GPA ACT
Characteristics of a Relationship • Direction (sign) • +: Positive • -: Negative
Direction • Positive As one variable increases, the other increases Scatterplot goes to the right Negative As one variable increases, the other decreases Scatterplot goes to the left
Magnitude • Strength of a relationship Closer to 1 or to -1, stronger the relationship Less predictive error Closer to 0, the weaker the relationship More error in prediction
Magnitude -- continued Zero correlation • Result of no systematic relationship between X and Y • Knowing X would be of no value in predicting Y
Magnitude -- continued Perfect correlations can be positive or negative Strong relationships can be either positive or negative The negative sign only indicates the direction of the relationship, not the strength or ability to predict
Interpretation Heuristic for Magnitude: Positive Correlation
Form • Form: Linear and non-linear relationships Linear: every change in X is accompanied by a corresponding change in Y
Nonlinear Relationship • No linear relationship • A change in X does not correspond to any predictable change in Y Example: 0 correlation Parabola
Nonlinear Relationships • Exponential • Time and retention
Retention Time
Performance Arousal
Use of Correlation • Reliability Test-retest and split-half 2. Personality Correlating test scores on personality tests: scales with similar traits should have high correlations, and scales with differing or opposite traits should have lower correlations
Pearson Product-Moment Correlation • Measures the direction and strength of the linear relationship between two variables
Pearson Product-Moment Correlation -- continued degree to which X and Y vary together (covariance) • divided by the variations in X and the variation in Y • See p. 462 for the computational formula
Correlation and Causality Correlation does not imply causality Cause requires 3 criteria: (1) temporal; (2) correlation; and (3) nonspuriousness—relationship cannot be explained by a third variable Cause: relationship between x (presumed cause) and Y (effect)
Poverty and Crime • Poverty and crime are related, as arrest statistics indicate Does poverty “cause” crime? There are poor people who do not commit crime and non-poor people who do
Factors Affecting Pearson Correlation Restricted range • Could overestimate or underestimate Example The correlation between ACT and GPA will be much lower if you look at the range between 24 and 30
Interpreting Correlation in Terms of Variance Coefficient of Determination • Proportion of variance of Y that is explained or accounted for by the variance of X r squared
Coefficient of Nondetermination Proportion of variance of Y that is not explained or accounted for by the variance of X
SPSS Procedure Graphs • Use to generate scatterplot • Determine whether the relationship is linear • Graphs, Scatter • Simple • Define
SPSS Procedure Correlate • Analyze, Correlate, Bivariate • Move variables over • Options • Statistics • Means and standard deviations
SPSS Procedure Correlate Output • Descriptive Statistics • Variables • Mean • Standard Deviation • N • Correlations • Pearson Correlation • Sig (2-tailed) • N
Hypothesis Tests With Pearson Correlations • H0: The population correlation is zero • H1: The population correlation is non-zero • (rho) • df = N - 2
Report Writing • A correlation for the data revealed that population and crime rate were significantly related, (r = .97, p < .01).