Download
1 / 13
130 likes | 290 Vues
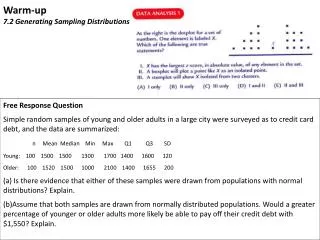
Warm-up An Exercise in Sampling: Rolling Down the River. What will the treatment be? What will the response variable be? How will the response variable be measured? What will the experimental unit be? Specify the experimental conditions to be used by

E N D
Warm-upAn Exercise in Sampling: Rolling Down the River • What will the treatment be? • What will the response variable be? • How will the response variable be measured? • What will the experimental unit be? • Specify the experimental conditions to be used by considering factors that might have ….what, if anything, should be done to control this variation. 6. Skip this one…
4.3 E #25 – 26 a and b 25) a. There is radomization of the 10 plants there are split into the 2 groups. There is replication. Five plants are getting each of the treatments. There is a control group because 5 plants are replanted in their natural environment. b. All ten plants need to be dug up so that confounding variables such as sun/shade are not confounded by dug up and not dug up. 26) a. The factors are powder and temperature. The levels are the 2 types of powder and the 3 types of temperature. There are 6 types of treatments. b. The metallurgist should use randomization in and test only one type of treatment at a time since there is only one oven. There should also be an equal number of powders in randomly selected areas of the oven.
4.3 # 26 c. and 27 c. This experiment could be blind if an assistant was the one to randomly selected the powder for each of the 3 temperatures. The metallurgist could record the results. 27. The units in this experiment are the dormitories. There are 20 dormitories. This is an experimental study.
Instructions for An Exercise in SamplingRolling Down the River • Answer all questions on a piece of paper in complete sentences. 2) BEFORE answering questions, for Sampling Methods B, C, D draw the 10 x 10 plot and explain how you used your calculator to do the specified sampling. Also show the results of the plots chosen using your method. 3) Also be sure to include the table with results before the observation questions. 4) For Observation #4 we will be writing the results on the board to the right of the classroom. 5) For Part II redraw the 10x10 plots describe your methods briefly if you used the same methods.
A.P. Statistics Selected Ch. 3 Test Answers 5. a. for the slope A, B, C was okay because the residual plot had too much variation. But the answers was really B. c. Is the correlation coefficient a good measure of association to use with the diameter versus age data? Briefly explain your answer. In part b. most of you calculated it to be 0.9 and said the association was strong BUT there was a patter in the residual so the correlation coefficient is not a good measure because the relationship may not be linear or there may be a lurking variable. 6. For the function 0.735 ∙ year – 59.5; it was important to describe slope as for every year younger the model of the car was the price went up $735. Lost 1 of 2 pts if you were not specific enough.
A.P. Statistics • 7. • Solve for R2 • 67% of the variation in calories can be attributed to the amount of fat.
Statistics Common Mistakes on Test fuel consumption = –5465.5 + 15.50 · speed 5. a. A – C was fine. It was really B. b. If the standard deviation of the fuel consumption is approximately 976.7 gal/h and the standard deviation of the speed is 54.8 mi/h, find the correlation between fuel consumption and speed. c. The residual plot had a pattern so the correlation coefficient, although it is considered strong, it is not a good indicator of the relationship between speed and fuel consumption. The U-shape of the residual means that the relationship is not linear OR that there is a lurking variable.
Statistics Common Mistakes on Test 8. b. c. The R2 is the coefficient of determination which describes the proportion of variation in the diameter that is determined by age.
Be Ready for 4.1 to 4.3 Vocabulary Quiz Next Class population, sample, sample size, sampling frame, voluntary response bias, convenience sampling, judgment samples, size bias, biased sampling methods, unrepresentative sample, nonresponse bias, questionnaire bias simple random sample, cluster sample, probability sample, two-stage sample and multistage sample, strata, stratified random sample, lurking variable, confounding variable, experimental study, observational study, control group, blind study, double-blind study, experimental units, randomization of treatment to subjects, replication, factors, levels, randomized block design, replication
A.P. Statistics and Statistics H.W. • For those teams that did not win the game, read and define 4.3 and 4.4 terms. • EVERYONE needs to complete up to #3 on Part 1 of the Rolling Down the River Activity • EVERYONE should prepare for the 4.1 to 4.3 Vocabulary Quiz