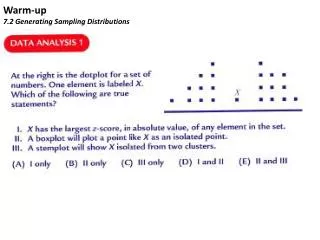
Warm-up 7.2 Generating Sampling Distributions
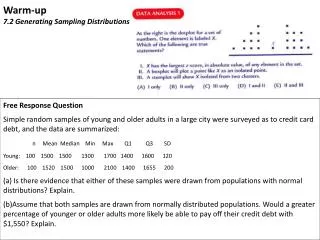
Warm-up 7.2 Generating Sampling Distributions. Free Response Question Simple random samples of young and older adults in a large city were surveyed as to credit card debt, and the data are summarized: n Mean Median Min Max Q1 Q3 SD

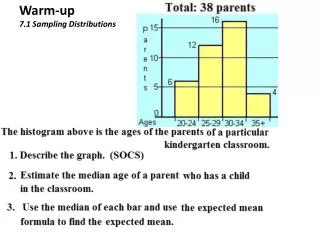
Warm-up 7.2 Generating Sampling Distributions
E N D
Presentation Transcript
Warm-up7.2 Generating Sampling Distributions Free Response Question Simple random samples of young and older adults in a large city were surveyed as to credit card debt, and the data are summarized: n Mean Median Min Max Q1 Q3 SD Young: 100 1500 1500 1300 1700 1400 1600 120 Older: 100 1520 1500 1000 2100 1400 1655 200 (a) Is there evidence that either of these samples were drawn from populations with normal distributions? Explain. (b)Assume that both samples are drawn from normally distributed populations. Would a greater percentage of younger or older adults more likely be able to pay off their credit debt with $1,550? Explain.
E #1 - 4 E1. a. b. The larger the sample size, the more trials listed under frequency for the true mean of the data. c. The larger the sample size the smaller the spread of the sampling distribution E 3. a. b. c. The midrange for the entire page is 1 + 18= 19/2 = 9.5 As shown in the table the true range is 7.5. The midrange of the samples will be higher than the average rectangle area.
7.2 Generating Sampling Distributions Sampling Distribution of a Mean If you toss two fair dice 10,000, how would you expect the histogram to look like if you were graphing the results of the average of two die?
Central Limit Theorem The sampling distribution of any mean becomes more nearly Normal as the sample size grows. Most importantly the observations need to be independent and collected with randomization. FYI “central” in the theorem name means “fundamental”
CLT and Equations • The CLT requires essentially the same assumptions and conditions from modeling proportions: Independence, Sample size, Randomization, 10% and large enough sample The standard deviation of the sampling distribution is sometimes called the standard error of the mean.
Properties of Sampling Distribution of Sample Meanpg 430 If a random sample of size n is selected from a population with mean and standard deviation , then • The mean of the sampling distribution of x equation equals the mean of the population, : • The standard deviation , the sampling distribution of , sometimes called the standard error of the mean: • Using the formula above you can find standard error of the sample mean without simulation
Physical Education Department and BMI study A college physical education department asked a random sample of 200 female students to self-report their heights and weights, but the percentage of students with body mass indexes over 25 seemed suspiciously low. One possible explanation may be that the respondents “shaded“ their weights down a bit. The CDC reports that the mean weight of 18-year-old women is 143.74 lb, with a standard deviation of 51.54 lb, but these 200 randomly selected women reported a mean weight of only 140 lb. Question: Based on the Central Limit Theorem and the 68-95-99.7 Rule, does the mean weight in this sample seem exceptionally low or might this just be random sample-to-sample variation?
7.1 to 7.2 Review Example 1: The Centers for Disease Control and Prevention reports that the average weight of a man is 190 lb with a standard deviation of 59 lb. An elevator in our building has a weight limit of 10 persons or 2500 lb. What’s the probability that if 10 men get on the elevator, they will overload its weight limit? Sampling Distribution MethodCombining Data Method
Example 2: Harold fails to study for his statistics final. The final has 100 multiple choice questions, each with 5 choices. Harold has no choice but to guess randomly at all 100 questions. What is the probability that Harold will get at least 30% on the test? Sampling Distribution Method Binomial Distribution Method H.W. 7.2 P #10 E#15, #23, and 24
Common Test Mistakes 2. Suppose you buy a raffle ticket in each of 25 consecutive weeks in support of your favorite charity. One of the 1200 raffle tickets sold each week pays $2000. What do you expect to win for those 25 weeks, and with what standard deviation? A. win about $0, give or take about $58 B. win about $25, give or take about $58 C. win about $42, give or take about $58 D. win about $42, give or take about $289 E. win about $210, give or take about $1443
3. Suppose Alex rolls a fair die until either a one or three appears on top. What is the probability that it will take Alex more than three rolls to get either a one or three the first time? A.B. C. D. E. FORM B 10. d. was not capable of being solved using Ch. 6 concepts.
Common Mistakes on Test what is the mean and standard deviation for the number of defects for pairs of shoes produced by this company. 1. This table gives the percentage of women who ultimately have a given number of children. For example, 19% of women ultimately have 3 children. What is the probability that two randomly selected women will have a combined total of exactly 2 children? Form A Form B 0 and 2, 1 and 1, 2 and 0 0.18* 0.35 + 0.17*0.17+ 0.35* 0.18 = 0.159 2. For the sake of efficiency, a shoe company decides to produce the left shoe of each pair at one site and the right shoe at a different site. If the two sites produce shoes with a number of defects reflected by
Expected Number of Success and Expected Number of Trials Binomial Distribution: Flipping a coin 6 times, about how many times flip head on average. In a simple random sample of 15 students, how many are expected to be younger than 20 . 60% of students are under 20. Geometric Distribution: Flipping a coin, when do you expect (on average) to have your first success. What is the expected number of interview before the second person withouthealth insurance is found? (16% no health insurance)
Expected Number of Success and Expected Number of Trials Binomial Distribution: Flipping a coin 6 times, about how many times flip head on average. What is the average number of students without laptops you would expect to find after sampling 5 random students? (60% w/ laptops) Geometric Distribution: Flipping a coin, when do you expect (on average) to have your first success. On average how many otters would biologists have to check before finding an infected otter? (20% are infected)