Asymmetry Dependence of the Nuclear Caloric Curve
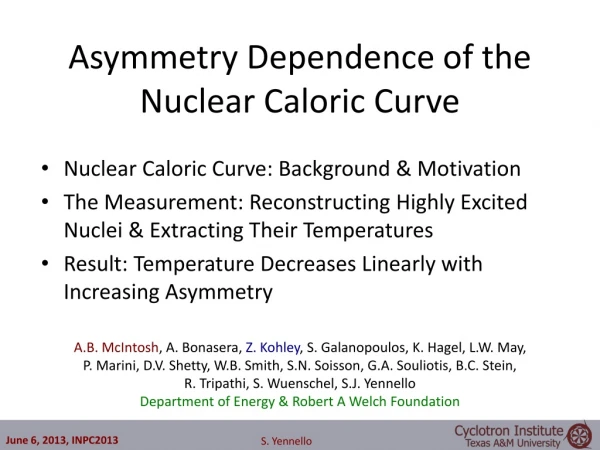
Asymmetry Dependence of the Nuclear Caloric Curve. Nuclear Caloric Curve: Background & Motivation The Measurement: Reconstructing Highly Excited Nuclei & Extracting Their Temperatures Result: Temperature Decreases Linearly with Increasing Asymmetry.

Asymmetry Dependence of the Nuclear Caloric Curve
E N D
Presentation Transcript
Asymmetry Dependence of the Nuclear Caloric Curve • Nuclear Caloric Curve: Background & Motivation • The Measurement: Reconstructing Highly Excited Nuclei & Extracting Their Temperatures • Result: Temperature Decreases Linearly with Increasing Asymmetry A.B. McIntosh, A. Bonasera, Z. Kohley, S. Galanopoulos, K. Hagel, L.W. May, P. Marini, D.V. Shetty, W.B. Smith, S.N. Soisson, G.A. Souliotis, B.C. Stein, R. Tripathi, S. Wuenschel, S.J. Yennello Department of Energy & Robert A Welch Foundation
Nuclear Caloric Curve • Essential Piece of Nuclear Equation of State: T vs E*/A • Search for & Study of Phase Transition • Liquid to Vapor • Evaporation to Multifragmentation Pochodzalla et al. PRL 75, 1040 (1995)
Tlim (MeV) E*/A (MeV) T (MeV) A E*/A (MeV) Nuclear Caloric Curve: Mass Dependence • With increasing mass: • Limiting temperature decreases • Onset of Tlim moves to lower Excitation energy Natowitz et al., PRC 65, 034618 (2002)
Caloric Curve: Asymmetry Dependence? asymmetry dependence • Mass Dependence of the caloric curve is measured. • Asymmetry Dependence: • Does it exist? • Which way does it go? • How strong is it? mass dependence http://en.wikipedia.org/wiki/File:NuclideMap_stitched_small_preview.png
Thermal Thomas-Fermi Model Kolomietz et al, Phys. Rev. C 64, 024315 (2001) Statistical Multifragmentation Model Ogul & Botvina, Phys. Rev. C 66, 051601 (2002) Isospin-Dependent Quantum Molecular Dynamics Su & Zhang, Phys. Rev. C 84, 037601 (2011) Hot Liquid Drop Model Besprosvany & Levit Phys. Lett B 217, 1 (1989) Caloric Curve: Asymmetry Dependence? Theory Different models make very different predictions about how the caloric curve depends on neutron-proton asymmetry n-Poor n-Poor n-Rich n-Rich Mononuclear Model Hoel, Sobotka & Charity, PRC 75, 017601 (2007) n-Rich n-Poor n-Poor n-Rich n-Poor n-Rich
Sfienti et al., PRL 102, 152701 (2009) S. Wuenschel, Ph.D. Thesis, 2009 Caloric Curve: Asymmetry Dependence? Experiment System E = 600A MeV E = 35A MeV Slight offset of neutron-rich system, but not statistically significant Possible dependence on asymmetry, but not for all impact parameters. Non-observation: Selection was on system composition. Should use reconstructed-source composition.
NIMROD-ISiS Array 70Zn + 70Zn 64Zn + 64Zn 64Ni + 64Ni E = 35A MeV • Full Silicon Coverage (4π) • Isotopic Resolution to Z=17 • Elemental Resolution to Zprojectile • Neutron Ball (4π)
1 3 4 2 Target & Projectile Quasi-Target & Quasi-Projectile Non-Central Collision De-excitation via particle decay Reconstructed QP Excited! Expanded! Density Gradients!
Event Selection & QP definition Remove particles that clearly do not belong (on average) to a statistically emitting projectile-like source Identity Reference Frame Excitation Select events with a well-measured QP: • Strength of the Measurement • Excellent isotopic resolution • 4π charged particle detection • Neutron multiplicity measurement • Excellent energy resolution • Well defined quasi-projectile source Select events with near-zero average momentum quadrupole. S. Wuenschel et al., PRC79, 061602 (2009) J.C. Steckmeyer et al., NPA686, 537 (2001)
Nuclear Thermometers Momentum Quadrupole Fluctuation Temperature Albergo Yield Ratio Temperature The quadrupole momentum distribution Account for binding energy differences and spin-degeneracies Contains information on the temperature through its fluctuations ~3% correction for secondary decay If f(p) is a Maxwell-Boltzmann distribution H. Zheng & A. Bonasera, PLB 696, 178 (2011) S. Albergo et al., Il NuovoCimento89, 1 (1985)
MQF (protons) Temperature • 48≤AQP ≤ 52 • 5 narrow asymmetry bins • Larger Asymmetry • Lower Temperature • > 1 MeV shift! • Evenly Spaced Neutron-poor Neutron-rich
MQF & Albergo Temperatures • 48≤AQP ≤ 52 • 5 narrow asymmetry bins Fluctuation Albergo • Both Thermometers: • Larger Asymmetry • Lower Temperature • Evenly Spaced
Importance of Reconstruction Asymmetry of Isotopically Reconstructed Source Asymmetry of Initial System Each system: Broad range of asymmetry • Larger Asymmetry • Lower Temperature • Observed either way, but… Much more pronounced for selection on source composition
Excitation Independence averages • Larger Asymmetry • Lower Temperature • Temperature shift does • not show a trend • with excitation. 4 of 10 pairwise differences shown
Asymmetry Dependence of Temperature Slope = -1.15MeV T_Albergo: ∆T = -0.2MeV Slope = -7.34MeV T_Fluctuation: ∆T = -1.2MeV
Caloric Curves for Light Charged Particles Tα, Tp < Td < Tt < Th Q-value for emission: ~10MeV for proton, alpha ~15MeV for deuteron ~20MeV for triton, helion Ordering of Temperatures Expensive Particles: Early times ∴Highest temperature Emission Order: S. Hudan et al., arXiv 0308031 (2003) L. Chen et al., Nucl. Phys. A 729, 809 (2003) R. Ghetti et al., Nucl. Phys. A 765, 307 (2006) Z. Kohley et al., Phys. Rev. C 86, 044605(2012) Different particles may also probe regions with different average density.
Asymmetry Dependence of Temperature ∆T / ∆ms α: -5.5 p: -7.3 d: -9.2 t: -9.3 h:-10.9 Same ordering as for temperature: Tα, Tp < Td < Tt < Th Strength of correlation: Source composition may evolve with time
Summary • Nuclear temperature depends on asymmetry • (↑Neutron content) (↓Temperature) • Linear correlation • Seen for 2 thermometers • Seen for all light charged particles • Source composition matters, not initial system • Intermediate energy • Excitation: no influence on asymmetry dependence ( 2.5 < E*/A < 8.5 MeV ) • Temperature ordering of LCPs • Consistent with emission time ordering • Impact of local density?