How-To Guide -Infographics
80 likes | 104 Vues
This How-To Guide will outline the key elements of an infographic, how infographics benefit marketers, and provides an action plan on how to create infographics that will become valuable marketing tools. Download this guide @ http://www.demandmetric.com/content/increase-your-presence-infographics

How-To Guide -Infographics
E N D
Presentation Transcript
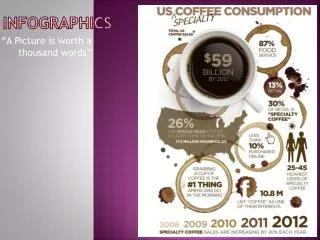
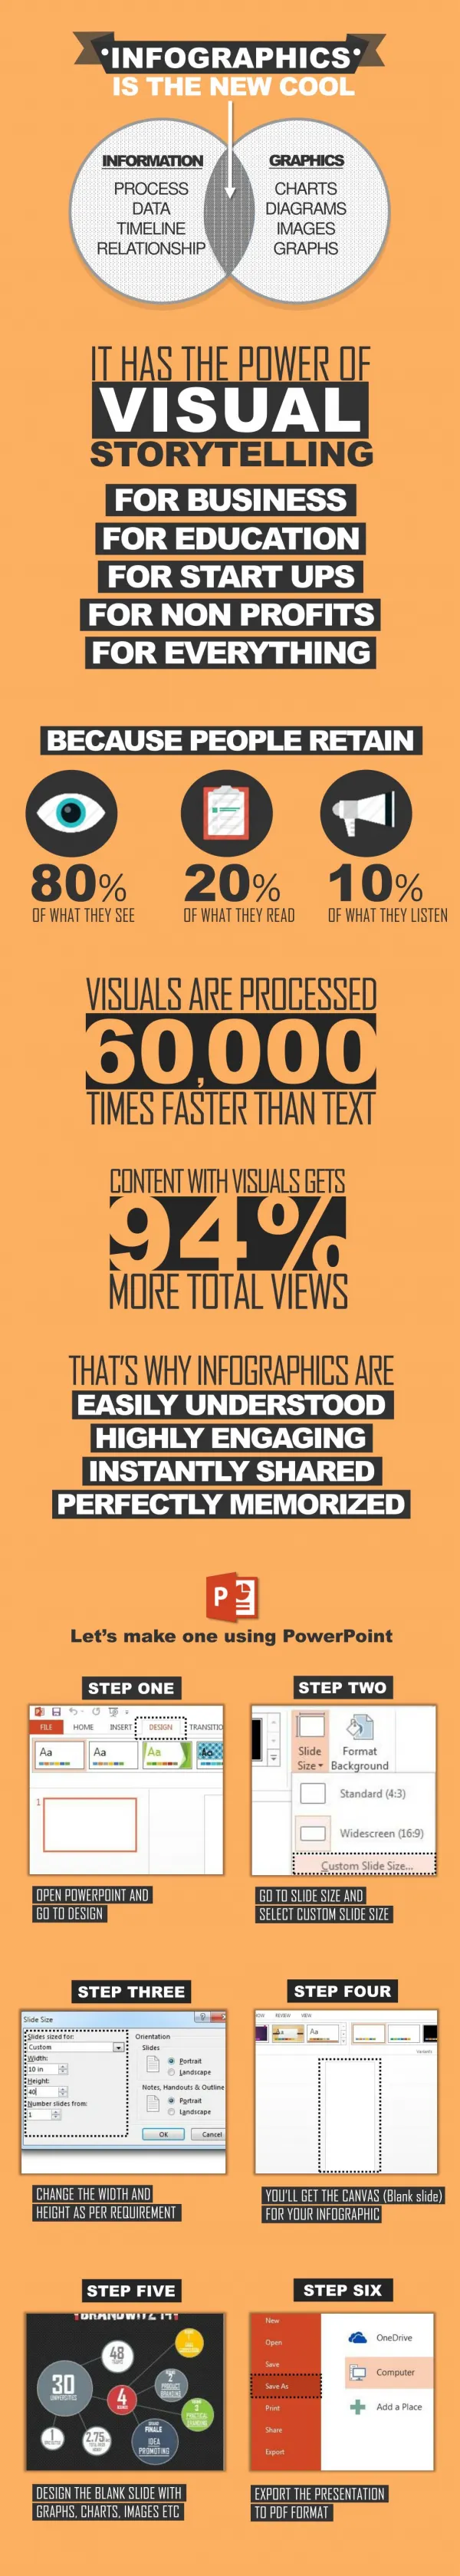
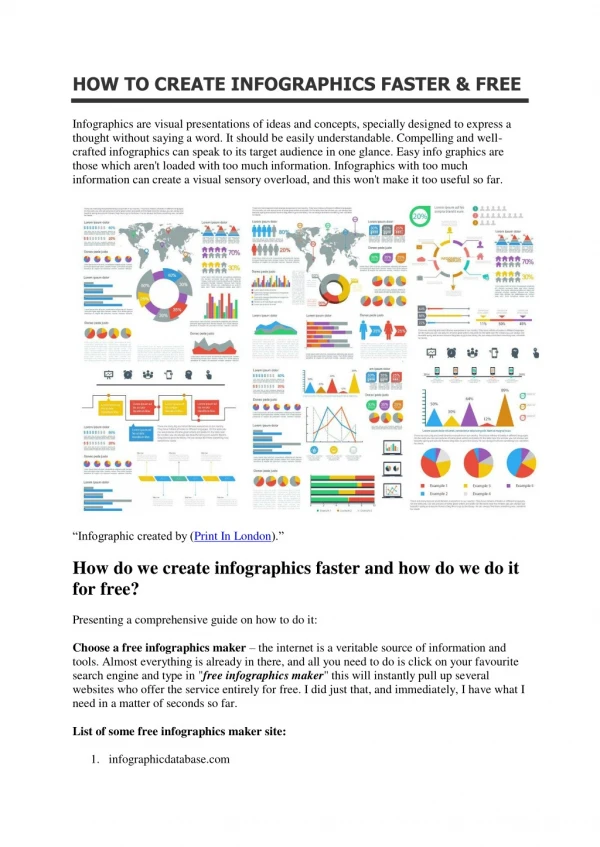
How-To Guide -Infographics How-To GuideInfographicsExecutive SummaryA picture is worth a thousand words. The brain processes visual information more quicklythan text and it retains more of that information. 90% of information transmitted to thebrain is visual and visuals are processed 60,000 times faster in the brain than text.Infographics exploit the brain’s power to absorb images, allowing us to capitalize on theadvantages visuals can have over text.An infographic is a visual representation of information, data and knowledge that isintended to quickly and clearly communicate complex data. Devices include maps, charts,diagrams, lists and graphs. Infographics tell us a story using accurate information and datain a visual form. Infographics help access information as quickly as possible by providingviewers with a snapshot of complex data that is easy to read and enables sharing of a lotof information in a short amount of time. Easily shareable, infographics have the ability togenerate lots of web traffic and for this reason are valuable marketing tools.This How-To Guide will outline the key elements of an infographic, how infographicsbenefit marketers, and provides an action plan on how to create infographics that willbecome valuable marketing tools.InfographicsThere are many elements to a creative, successful, attention-grabbing infographic.Infographics are essentially stories containing accurate content, controllable design, easyintegration and versatility – all advantages from which marketers can benefit. Whenstarting to integrate infographics into your marketing mix, be aware of following keyfeatures and advantages that they provide. © 2013 Demand Metric Research Corporation. All Rights Reserved.
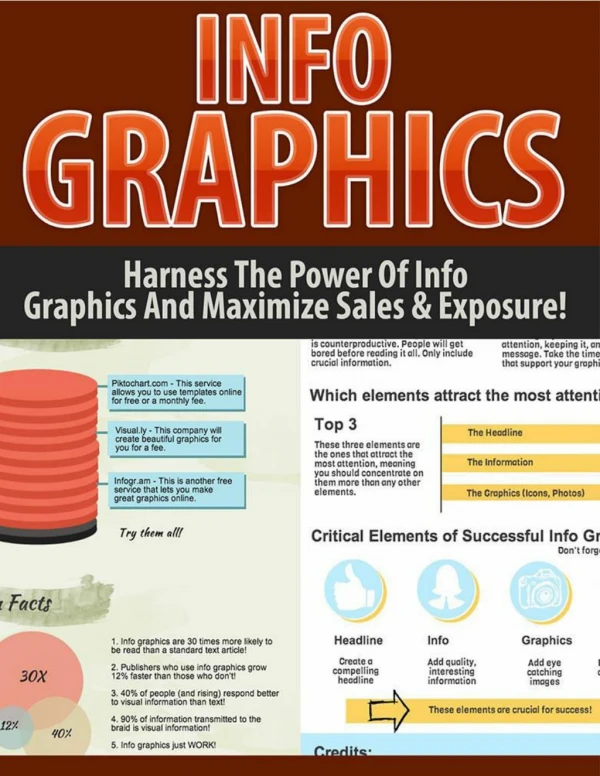
How-To Guide Tells A Story o An infographic uses graphics to convey a story or message as a visual sequence. o The creative use of graphics helps people to understand the message or story being delivered and increases retention. Accurate Data o A key feature of most infographics is statistical data. Viewers are drawn to statistics so make sure they are accurate. A single inaccurate statistic will damage the credibility of the entire infographic. o Infographics are great for creating brand awareness, so make sure your infographic accurately representing your brand. o Your graphics may attract viewers, inviting them to investigate your website or company more deeply. Have plenty of supporting content to satisfy the interest your infographics create. Controllable o You have complete editorial control over the design and the content used in an infographic. o Even though data is data, your infographic can provide value by helping the viewer understand the implications of the data in the story you tell. o The design of your infographics can become a brand all to itself, becoming recognized for being informative and providing value. © 2013 Demand Metric Research Corporation. All Rights Reserved. How-To Guide Tells A Story o An infographic uses graphics to convey a story or message as a visual sequence. o The creative use of graphics helps people to understand the message or story being delivered and increases retention. Accurate Data o A key feature of most infographics is statistical data. Viewers are drawn to statistics so make sure they are accurate. A single inaccurate statistic will damage the credibility of the entire infographic. o Infographics are great for creating brand awareness, so make sure your infographic accurately representing your brand. o Your graphics may attract viewers, inviting them to investigate your website or company more deeply. Have plenty of supporting content to satisfy the interest your infographics create. Controllable o You have complete editorial control over the design and the content used in an infographic. o Even though data is data, your infographic can provide value by helping the viewer understand the implications of the data in the story you tell. o The design of your infographics can become a brand all to itself, becoming recognized for being informative and providing value. © 2013 Demand Metric Research Corporation. All Rights Reserved.
How-To Guide Easily Integrated o Infographics are easily integrated into websites and blogs. o Including and embedding your infographics on your website and in social media sites generates more traffic, views and shares.Very Versatile o You can use almost any type of information to create an infographic. o The communication of any message, story, data set or idea is enhanced when rendered as a creative and compelling display of information.Benefits for BusinessSEO and Driving Traffic Infographics are beneficial to marketers primarily though the traffic and inbound links they generate. Attention-grabbing tools that draw readers in, infographics are capable of creating a significant amount of traffic to your website. The increased traffic benefits your SEO and improves your search ranking. As people find and share your infographic, they will build a number of inbound links that point to your website, enhancing your online presence. In addition to the significant traffic infographics can create, they are also easily shared. Compelling infographics become a web traffic multiplier because of the extensive sharing that occurs. This sharing is a function of the quality of your infographic, both in terms of visual appeal and accurate data, so invest the time and resources to create compelling ones with the © 2013 Demand Metric Research Corporation. All Rights Reserved. How-To Guide Easily Integrated o Infographics are easily integrated into websites and blogs. o Including and embedding your infographics on your website and in social media sites generates more traffic, views and shares.Very Versatile o You can use almost any type of information to create an infographic. o The communication of any message, story, data set or idea is enhanced when rendered as a creative and compelling display of information.Benefits for BusinessSEO and Driving Traffic Infographics are beneficial to marketers primarily though the traffic and inbound links they generate. Attention-grabbing tools that draw readers in, infographics are capable of creating a significant amount of traffic to your website. The increased traffic benefits your SEO and improves your search ranking. As people find and share your infographic, they will build a number of inbound links that point to your website, enhancing your online presence. In addition to the significant traffic infographics can create, they are also easily shared. Compelling infographics become a web traffic multiplier because of the extensive sharing that occurs. This sharing is a function of the quality of your infographic, both in terms of visual appeal and accurate data, so invest the time and resources to create compelling ones with the © 2013 Demand Metric Research Corporation. All Rights Reserved.
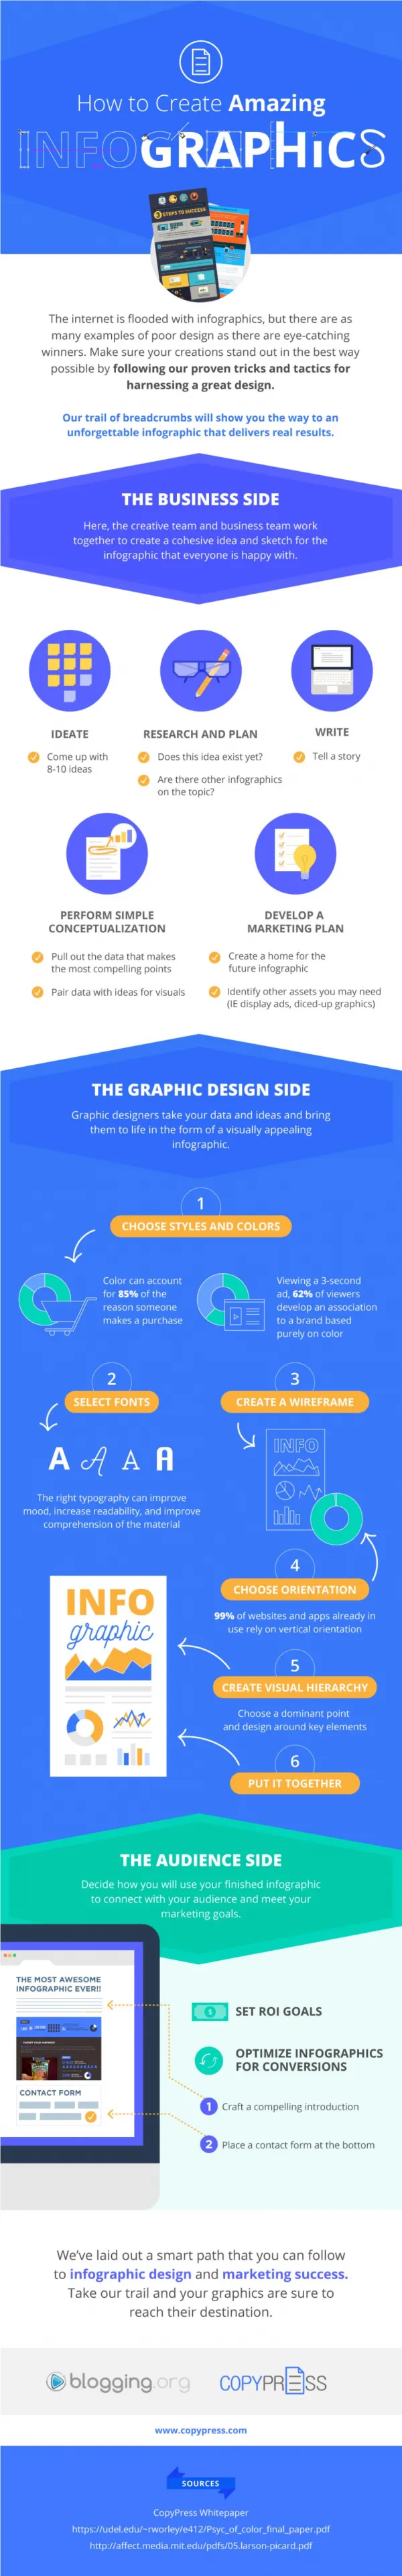
How-To Guide ability to quickly “go viral”. Because infographics are scalable, shareable and brandable, they can add tremendous value to your SEO campaign.Credibility An infographic is an excellent vehicle for conveying your expertise. Through the use of accurate data, statistics, insights and references, your infographic builds credibility by showing that you are extremely knowledgeable on a subject. An infographic does more than just use a variety of statistics and facts to reduce a complex data set to a manageable and eye catching visual representation – it enhances your reputation as a thought leader.Brand Awareness Infographics create brand awareness and increase brand recall due to the retention rates of visual information over text. Readers of the infographic are not only more aware of your brand but also recall it better, which influences decision-maker purchase consideration. People are visual learners, processing visuals quickly, so they are drawn to images. Research shows that the action of sharing increases brand recall by 63%. Due to the large amounts of sharing and the viral nature of infographics, they are powerful reinforcers of your brand in the market place.Action Plan 1. Create an outline Even though your goal is a graphic, this process starts with text. Outline the story you wish to tell, emphasizing the key messages and identifying the kinds of statistics that will help you convey it. © 2013 Demand Metric Research Corporation. All Rights Reserved. How-To Guide ability to quickly “go viral”. Because infographics are scalable, shareable and brandable, they can add tremendous value to your SEO campaign.Credibility An infographic is an excellent vehicle for conveying your expertise. Through the use of accurate data, statistics, insights and references, your infographic builds credibility by showing that you are extremely knowledgeable on a subject. An infographic does more than just use a variety of statistics and facts to reduce a complex data set to a manageable and eye catching visual representation – it enhances your reputation as a thought leader.Brand Awareness Infographics create brand awareness and increase brand recall due to the retention rates of visual information over text. Readers of the infographic are not only more aware of your brand but also recall it better, which influences decision-maker purchase consideration. People are visual learners, processing visuals quickly, so they are drawn to images. Research shows that the action of sharing increases brand recall by 63%. Due to the large amounts of sharing and the viral nature of infographics, they are powerful reinforcers of your brand in the market place.Action Plan 1. Create an outline Even though your goal is a graphic, this process starts with text. Outline the story you wish to tell, emphasizing the key messages and identifying the kinds of statistics that will help you convey it. © 2013 Demand Metric Research Corporation. All Rights Reserved.
How-To Guide2. Research facts and statistics Accurate facts and statistics are key to ensuring credibility and brand awareness. Do your research to find credible data to back up your message. Captivating images are good for grabbing the reader’s attention, however, all the content, not just the images; need to be compelling as well as concise. Using a basic statistic especially to start the infographic will help engage the viewers right away. Use reference links at the bottom of the infographic to show your data sources.3. Include a title Use a headline or title for your infographic that introduces the topic and explains why it is important to your target audience.4. Develop and present your story using graphics Find the images you can use to help tell your story and create a layout that is creative and appealing. At each step or section of your infographic, include an image that will help explain and support that step.5. Decide on a color scheme Choose a color palate that will attract readers, help deliver the story most effectively and make your infographics easily recognizable. © 2013 Demand Metric Research Corporation. All Rights Reserved. How-To Guide2. Research facts and statistics Accurate facts and statistics are key to ensuring credibility and brand awareness. Do your research to find credible data to back up your message. Captivating images are good for grabbing the reader’s attention, however, all the content, not just the images; need to be compelling as well as concise. Using a basic statistic especially to start the infographic will help engage the viewers right away. Use reference links at the bottom of the infographic to show your data sources.3. Include a title Use a headline or title for your infographic that introduces the topic and explains why it is important to your target audience.4. Develop and present your story using graphics Find the images you can use to help tell your story and create a layout that is creative and appealing. At each step or section of your infographic, include an image that will help explain and support that step.5. Decide on a color scheme Choose a color palate that will attract readers, help deliver the story most effectively and make your infographics easily recognizable. © 2013 Demand Metric Research Corporation. All Rights Reserved.
How-To Guide6. Draw conclusions Work to tell the entire story, but in as concise a way as possible. Always draw conclusions or share insights about the information you are sharing.7. Include your URL on your infographic so people know who made it Include your website URL and brand your infographic so it is easily attributed to you.8. Share with your audience Post your infographic on your website, blog, Facebook, Twitter etc. Kick start the process to allow your infographic to go viral. Make your infographic easy to share. © 2013 Demand Metric Research Corporation. All Rights Reserved. How-To Guide6. Draw conclusions Work to tell the entire story, but in as concise a way as possible. Always draw conclusions or share insights about the information you are sharing.7. Include your URL on your infographic so people know who made it Include your website URL and brand your infographic so it is easily attributed to you.8. Share with your audience Post your infographic on your website, blog, Facebook, Twitter etc. Kick start the process to allow your infographic to go viral. Make your infographic easy to share. © 2013 Demand Metric Research Corporation. All Rights Reserved.
How-To GuideAn Infographic that we love (and more info about infographics): © 2013 Demand Metric Research Corporation. All Rights Reserved. How-To GuideAn Infographic that we love (and more info about infographics): © 2013 Demand Metric Research Corporation. All Rights Reserved.
How-To GuideBottom LineInfographics are a useful way to represent complex data in an easy to understand,visually appealing fashion that drives traffic, increases brand awareness and earnscredibility. Using accurate data and quality, relevant content, infographics are an effective,creative way to market your brand. Take advantage of the human brain’s ability to quicklyprocess visual data by publishing your content, ideas and expertise in the form ofinfographics. © 2013 Demand Metric Research Corporation. All Rights Reserved. How-To GuideBottom LineInfographics are a useful way to represent complex data in an easy to understand,visually appealing fashion that drives traffic, increases brand awareness and earnscredibility. Using accurate data and quality, relevant content, infographics are an effective,creative way to market your brand. Take advantage of the human brain’s ability to quicklyprocess visual data by publishing your content, ideas and expertise in the form ofinfographics. © 2013 Demand Metric Research Corporation. All Rights Reserved.