Download
1 / 2
30 likes | 153 Vues
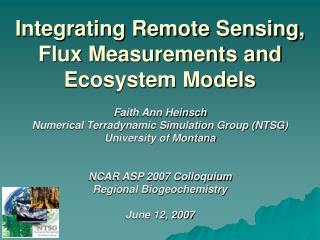
Bridging the Gap in Scales between Flux Towers, Ecosystem Models and Remote Sensing R.J. Olson 1 , R.B. Cook 1 , L.M. Olsen 1 , T. A. Boden 1 , J.T. Morisette 2 , and S.W. Running 3 1 Oak Ridge National Laboratory, Environmental Sciences Division, Oak Ridge, TN 37831-6038 United States*

E N D
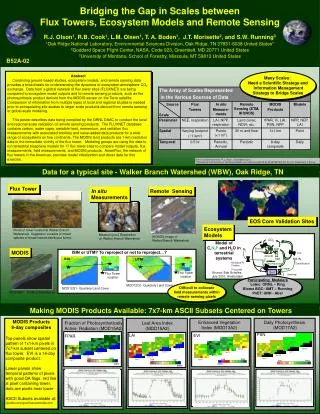
Bridging the Gap in Scales between Flux Towers, Ecosystem Models and Remote Sensing R.J. Olson1, R.B. Cook1, L.M. Olsen1, T. A. Boden1, J.T. Morisette2, and S.W. Running3 1Oak Ridge National Laboratory, Environmental Sciences Division, Oak Ridge, TN 37831-6038 United States* 2Goddard Space Flight Center, NASA, Code 923, Greenbelt, MD 20771 United States 3University of Montana, School of Forestry, Missoula, MT 59812 United States Index (MOD13A2) Enhanced Vegetation Index (MOD13A2) Daily Photosynthesis (MOD17A2) PSN EVI Sept 30 Sept 30 July 14 July 14 May 25 May 25 April 7 low high April 7 high low water Model of C,N,P and H2O in terrestrial systems Source: Bob Scholes, July 2001, Amsterdam low low high high water water Photo of tower located at Walker Branch Watershed. Vegetation consists of mixed species of broad-leaved deciduous forest. l ISIN or UTM? To reproject or not to reproject…? FPAR - Leaf Area Index (MOD15A2) ISIN LAI FPAR Flux Tower location Flux Tower location Sept 30 Sept 30 July 14 MOD12Q1- Quarterly Land Cover July 14 MOD09A1 - Surface Reflectance May 25 May 25 MOD12Q1- Quarterly Land Cover April 7 April 7 CO2 Rubisco Stomata Leaf N2 Fire Allocation Wood N2O, N2 Biological N Fixation P required Decomposition Denitrification Soil water Soil Leaching B52A-02 Abstract Combining ground-based studies, ecosystem models, and remote sensing data provides a broad basis for understanding the dynamics of ecosystem-atmosphere CO2 exchange. Data from a global network of flux tower sites (FLUXNET) are being compared to ecosystem model outputs and to remote sensing products, such as the photosynthesis product derived from the MODIS sensor on the Terra satellite. Comparison of information from multiple types of local and regional studies is needed prior to extrapolating site studies to larger-scale products derived from remote sensing or global-scale modeling. This poster describes data being compiled by the ORNL DAAC to conduct the local and regional scale validation of remote sensing products. The FLUXNET database contains carbon, water vapor, sensible heat, momentum, and radiation flux measurements with associated ancillary and value-added data products for a wide range of ecosystems on five continents. The MODIS land products are 1-km resolution data in the immediate vicinity of the flux tower. Modeling groups are using the data to run terrestrial biosphere models for 17 flux tower sites to compare model outputs, flux measurements, field measurements, and MODIS products. AmeriFlux, the network of flux towers in the Americas, provides model initialization and driver data for this exercise. Many Scales: Need a Scientific Strategy and Information Management Strategy to Bridge Scales Email Contact Information: R. J. Olson <olsonrj@ornl.gov> *Managed by the University of Tennessee-Battelle LLC under contract DE-AC05-00OR22725 with the U.S. Department of Energy Data for a typical site - Walker Branch Watershed (WBW), Oak Ridge, TN Flux Tower In situ Measurements Remote Sensing EOS Core Validation Sites Ecosystem Models Measuring soil Respiration on Walker Branch Watershed IKONOS Image of Walker Branch Watershed. MODIS UTM Participating Modelers Lotec: ORNL – King Biome BGC: UMT – Running PnET: UNH - Aber Difficult to collocate field measurements within remote sensing pixels Making MODIS Products Available: 7x7-km ASCII Subsets Centered on Towers MODIS Products 8-day composites Top panels show spatial pattern of 1x1-km pixels in 7x7-km subset centered on flux tower. EVI is a 16-day composite product. Lower panels show temporal patterns of pixels with good QA flags, red line is pixel containing tower, dots are pixels near tower ASCII Subsets available at: //public.ornl.gov/fluxnet/modis.cfm Fraction of Photosynthetically Active Radiation (MOD15A2)
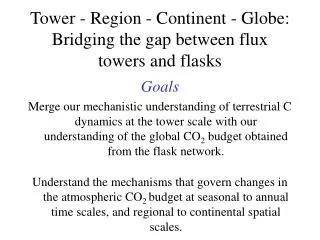
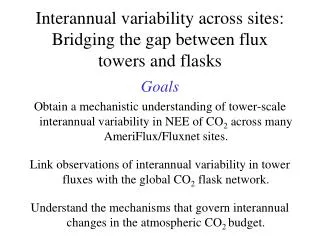
Strategies for Bridging Scales to Compare Diverse Observations B52A-02 Scientific Strategy: Collocate data in time and space Information ManagementStrategy: Collocate data at central site or with Internet links • 26 Core Sites in 6 biomes, sites with active research programs • Flux towers using eddy covariance methods to sample large footprint • Gap-filling of flux data to create complete temporal record • BigFoot project to develop spatial scaling methods • Fine-scale remote sensing to scale-up point measurements • Models to estimate parameters that are difficult to measure and to bridge scales • CDIAC/AmeriFlux • Model initialization parameters • Weekly micromet data • Initial 0. 5 hr flux data • Modeling Groups • Estimating NPP and NEP for flux towers • MODIS • 25 sites • 8 products Individual Site Data • DAAC/FLUXNET • MODIS products – 7x7 cutouts • FLUXNET gap-filled data • Links to field data via Mercury Comparison Workshops Additional validation data Comparing MODIS LAI product to LAI field measurements MODIS LAI (2001) – red line - 8-day composites with high quality QA flags - average of 1x1 km pixels near flux tower Field LAI measurements (1996 – 1999) - relative LAI with max LAI=1.0 - measured at a point near tower - Source: Paul Hanson, ORNL Comparisons - MODIS LAI shows similar greening pattern in spring as field data; however, fall pattern shows earlier leaf-off - it is not clear why the MODIS LAI shows significant drop around day 151 WBW is a deciduous forest with annual leaf-on and leaf-off phenology Validation “Assessing by independent means the uncertainties of data products” First Steps to Bridge the Gap in Scales, Illustrated with Walker Branch Watershed Data Gap-filled Flux Tower NEE for 1996-1998 MODIS PSN for 2001 (red) and NEE for 1996-1998 Model Outputs (ensemble including Biome BGC) versus Measured NPP Biome BGCModel NEP for 2000 and 2001 and NEE for 1996-1998 MODIS PSN for 2001 and Biome BGC Model NEP Outputs for 2000 and 2001 ½ hr NEE data gap-filled and summed to 8-day periods Years differ, MODIS 8-day composite (best day in period) multiplied by 8 Models tended to be higher than data at low NPP sites, lower at high NPP sites Daily model outputs summed to 8-day periods MODIS PSN is mean of 3x3-km subset, BGC NEP is for tower site Data Resources for Many Applications Available for EOS Core Sites Data Collection and Flux-Model-MODIS Comparisons are Ongoing • Ongoing Concerns • Testing and refining of the comparison strategies are needed • Spatial differences - scaling of points to cells, comparing one pixel vs. subsets • Temporal differences – satellite 8-day vs. field observation on a specific day • Data inconsistencies - methods, variables, formats • Sites - 26 core and ~170 towers site; need for a wider variety of ecosystem types • Formal Comparisons • Ecosystem Model-Data Intercomparison (EMDI 3) • 12 Modeling Groups • NPP, NEE flux, MODIS products • Kathy Hibbard, <kathyh@eos.sr.unh.edu> • Santa Barbara, CA; April 21-24, 2002 • MODIS Vegetation Workshop • Products: fPAR, LAI, VI, PSN • Steve Running, <swr@ntsg.umt.edu> • Missoula, MT, July 16-18, 2002 • http://www.forestry.umt.edu/ntsg/MODISMTG/ URLs for Data • Summary • Strategies for supporting validation have been designed and reviewed - tested and refinements are ongoing • Distribution systems are in place and working • Validation data are available and more data are being added • Plans are in place to hold workshops and communicate validation results via special journal issues