Clustering Analysis of 5-HT4 Ligands Using Chemical and Pharmacophore Fingerprints
This study evaluates the clustering efficiency of various fingerprint descriptors and metrics for 5-HT4 ligands, focusing on their pharmacological activity. Our results indicate that the Energy method, combined with the Ward and Canberra metrics, yields optimal classification results. The analysis was performed using a comprehensive chemical library of over 10,000 compounds, identifying active, intermediate, and inactive clusters with significantly high Quality Clustering Index (QCI) values. These findings highlight the potential of hierarchical clustering methods in drug discovery for serotonergic compounds.

Clustering Analysis of 5-HT4 Ligands Using Chemical and Pharmacophore Fingerprints
E N D
Presentation Transcript
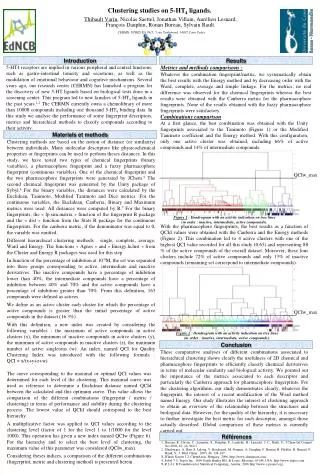
Clustering studies on 5-HT4 ligands. Thibault Varin, Nicolas Saettel, Jonathan Villain, Aurélien Lesnard, François Dauphin, Ronan Bureau, Sylvain Rault. CERMN, UPRES EA 3915, 5 rue Vaubénard, 14032 Caen Cedex Introduction Results Metrics and methods comparisons : Whatever the combination fingerprint/metric, we systematically obtain the best results with the Energy method and by decreasing order with the Ward, complete, average and simple linkage. For the metrics, no real difference was observed for the chemical fingerprints whereas the best results were obtained with the Canberra metric for the pharmacophore fingerprints. None of the results obtained with the fuzzy pharmacophore fingerprints were satisfactory. 5-HT4 receptors are implied in various peripheral and central functions, such as gastro-intestinal tonicity and secretions, as well as the modulation of emotional behaviour and cognitive mechanisms. Several years ago, our research center (CERMN) has launched a program for the discovery of new 5-HT ligands based on biological tests done in a screening center. This program led to new families of 5-HT4 ligands in the past years.1,2The CERMN currently owns a chemolibrary of more than 10000 compounds including one thousand 5-HT4 binding data. In this study we analyse the performance of some fingerprint descriptors, metrics and hierarchical methods to classify compounds according to their activity. Combinations comparison At a first glance, the best combination was obtained with the Unity fingerprints associated to the Tanimoto (Figure 1) or the Modified Tanimoto coefficient and the Energy method. With this configuration, only one active cluster was obtained, including 66% of active compounds and 14% of intermediate compounds. Materials et methods Clustering methods are based on the notion of distance (or similarity) between individuals. Many molecular descriptors like physicochemical properties or fingerprints can be used to perform theses distances. In this study, we have tested two types of chemical fingerprints (binary variables), a pharmacophore fingerprint and a fuzzy pharmacophore fingerprint (continuous variables). One of the chemical fingerprint and the two pharmacophore fingerprints were generated by JChem.3 The second chemical fingerprint was generated by the Unity package of Sybyl.4 For the binary variables, the distances were calculated by the Euclidean, Tanimoto, Modified Tanimoto and Dice metrics. For the continuous variables, the Euclidean, Canberra, Binary and Maximum metrics were used. All distances were computed by R.5 For the binary fingerprints, the « fp.sim.matrix » function of the fingerprint R package and the « dist » function from the Stats R package for the continuous fingerprints. For the canberra metric, if the denominator was equal to 0, the variable was omitted. Different hierarchical clustering methods : single, complete, average, Ward and Energy. The functions « Agnes » and « Energy.hclust » from the Cluster and Energy R packages was used for this step. In function of the percentage of inhibition at 10-6M, the set was separated into three groups corresponding to active, intermediate and inactive derivatives. The inactive compounds have a percentage of inhibition lower than 40%, the intermediate compounds have a percentage of inhibition between 40% and 70% and the active compounds have a percentage of inhibition greater than 70%. From this definition, 163 compounds were defined as actives. We define as an active cluster each cluster for which the percentage of active compounds is greater than the initial percentage of active compounds in the dataset (16.3%). With this definition, a new index was created by considering the following variables : the maximum of active compounds in active clusters (x), the minimum of inactive compounds in active clusters (y), the minimum of active compounds in inactive clusters (z), the minimum number of active singletons (w). An index, named QCI for Quality Clustering Index was introduced with the following formula : QCI = x/(x+y+z+w). QCIw_max Figure 1 : Dendrogram with an activity indication on tree lines (in order : inactive, intermediate, active compounds). With the pharmacophore fingerprints, the best results as a function of QCId values were obtained with the Canberra and the Energy methods (Figure 2). This combination led to 4 active clusters with one of the highest QCI value recorded for all this study (0.65) and representing 88 % of the active compounds of the overall dataset. Moreover, these four clusters include 72% of active compounds and only 13% of inactive compounds (remaining set correspond to intermediate compounds). QCIw_max Figure 2 : Dendrogram with an activity indication on tree lines (in order : inactive, intermediate, active compounds). Conclusion These comparative analyses of different combinations associated to hierarchical clustering shows clearly the usefulness of 2D chemical and pharmacophore fingerprints to efficiently classify chemical derivatives in terms of molecular similarity and biological activity. We pointed out the importance of the metrics associated to each descriptor and particularly the Canberra approach for pharmacophore fingerprints. For the clustering algorithms, our study demonstrates clearly, whatever the fingerprint, the interest of a recent modification of the Ward method named Energy. Our study illustrates the interest of clustering approach to obtain an overview of the relationship between the structures and biological data. However, for the quality of the hierarchy, it is necessary to further investigate the best metric for each descriptor, amongst those actually described. Global comparison of these metrics is currently carried out. The curve corresponding to the maximal or optimal QCI values was determined for each level of the clustering. This maximal curve was used as reference to determine a Euclidean distance named QCId between the calculated and this optimum curve. This value allows the comparison of the different combinations (fingerprint / metric / clustering) in terms of performance and stability during the clustering process. The lowest value of QCId should correspond to the best hierarchy. A multiplicative factor was applied to QCI values according to the clustering level (factor of 1 for the level 1 to 1/1000 for the level 1000). This operation has given a new index named QCIw (Figure 6). For the hierarchy and to select the best level of clustering, the maximum value of this parameter was considered (QCIw_max). Considering theses indices, a comparison of the different combinations (fingerprint, metric and clustering method) is presented herein. Références • Bureau, R.; Daveu, C.; Lemaitre, S.; Dauphin, F.; Landelle, H.; Lancelot, J. C.; Rault, S., J Chem Inf Comput Sci 2002, 42, (4), 962-7. • Hinsberger, A. Butt, S. Lelong, V. Boulouard, M. Dumuis, A. Dauphin, F. Bureau, R. Pfeiffer, B. Renard, P. Rault, S., J. Med. Chem., 2003, 46, 138-147 • 3. JChem Screen 3.2, ChemAxon, Hungary, 2006, http://www.chemaxon.com. • 4. Sybyl 7.3, Tripos Inc., 1699 South Hanley RD, St Louis, Missouri, 63144, USA, http://www.tripos.com • 5. R 2.4.1, R Foundation for Statistical Computing, Austria, 2006,http://www.r-project.org.