
Uploaded by
demont
1 SLIDES
189 VUES
10LIKES
Mass Spectrometry Analysis of Protein Spots from MDA-MB-436 Cells via 2D IEF-PAGE
DESCRIPTION
This study focuses on the mass spectrometry analysis of five specific protein spots, identified by blue arrows in Figure 3C, extracted from MDA-MB-436 cells. Utilizing two-dimensional isoelectric focusing (IEF) and polyacrylamide gel electrophoresis (PAGE), we investigate the protein expression patterns and molecular characteristics of these spots. The findings provide insights into the proteomic landscape of breast cancer cells, potentially aiding in biomarker discovery and therapeutic target identification.
Download
1 / 1
Télécharger la présentation 
Mass Spectrometry Analysis of Protein Spots from MDA-MB-436 Cells via 2D IEF-PAGE
An Image/Link below is provided (as is) to download presentation
Download Policy: Content on the Website is provided to you AS IS for your information and personal use and may not be sold / licensed / shared on other websites without getting consent from its author.
Content is provided to you AS IS for your information and personal use only.
Download presentation by click this link.
While downloading, if for some reason you are not able to download a presentation, the publisher may have deleted the file from their server.
During download, if you can't get a presentation, the file might be deleted by the publisher.
E N D
Presentation Transcript
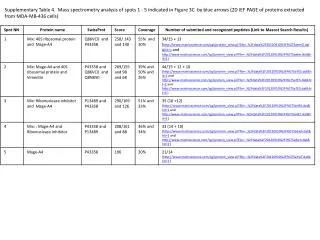
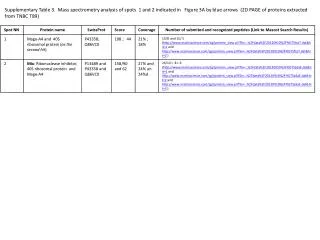
Supplementary Table 4. Mass spectrometry analysis of spots 1 - 5 indicated in Figure 3C by blue arrows (2D IEF PAGE of proteins extracted from MDA-MB-436 cells)


More Related