Download
1 / 20
210 likes | 379 Vues
Analysis of crop plant genomes. Jo Dicks John Innes Centre. jo.dicks@bbsrc.ac.uk http://jic-bioinfo.bbsrc.ac.uk/bioinformatics-research/. Data. We want to compare the genomes of crop plants (e.g. wheat, rice, maize, millets, barley, pea) At present, we mainly compare:

E N D
Analysis of crop plant genomes Jo Dicks John Innes Centre jo.dicks@bbsrc.ac.uk http://jic-bioinfo.bbsrc.ac.uk/bioinformatics-research/
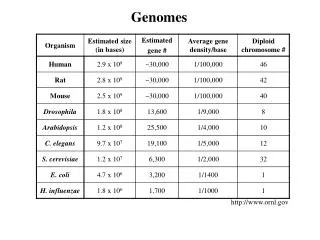
Data • We want to compare the genomes of crop plants (e.g. wheat, rice, maize, millets, barley, pea) • At present, we mainly compare: • Whole genome sequences • Genetic markers (comparative mapping) • Transposable elements
What can we learn from the data? • Understand evolutionary processes in crop plants. • Use comparative mapping to predict gene/marker locationandfunction across species. • Use transposable elements to maximise diversity within a subset of a germplasm collection (core collection).
Whole genome sequences • Linear streams of data, where each element is represented of one of four letters (A, C, G or T). • Streams can be long – billions of letters. • Blocks of sequence can be meaningful (e.g. they encode genes or transposable elements) or are deemed ‘junk’. Species 1: caggaaaacacacactcacatacatgaacaatatctc ||||| || ||||| |||||||| |||| || || Species 2: caggataatgcacac catacatgcacaaaat tc
Comparative mapping data • Markers have a location and an orientation. • When markers in two species are related by descent from a common ancestor, they are called homologues. • Comparative mapping data are combinatorial. Species 1 1 5 3 4 2 Species 2 1 2 4 5 In most data sets, links (homologies) may be spread across chromosomes
Retrotransposons • Retrotransposons are a type of transposable element. • There are various locations in a genome where they are either present or absent. • An entry in a germplasm collection (called an accession) is therefore essentially a barcode representing multiple retrotransposon locations. Accession 1 1 2 3 4 Accession 2 1 2 4
Evolution • Data change in time due to errors known as mutations (there are several distinct types of mutation). • Differences between species are often quantified in terms of the number and type of such mutations. • The relationship between species is often represented as a treeof evolution (often called a phylogenetic tree).
An evolutionary tree Ancestral species Species 1 Species 2 Species 3 Species 4 Mutations occur through time, along the tree branches
Data problems • In comparative mapping studies, there may be elements between the markers that are important but of which we know nothing (i.e. missing data) and erroneous links between data items (i.e. data errors). • Missing data will be largely alleviated by whole genome sequences (when will this be though?) but there will still be errors in the data.
Projects • UK CropNet (data) • CHROMTREE (analysis) • GENE-MINE (data) • Germinate (analysis) • JIC are also involved in Arabidopsis and Brassica IGF projects
UK CropNet databases • UK CropNet curates and develops databases and data analysis tools for: • Arabidopsis thaliana (AGR) • Brassicas (BrassicaDB) • Cereals (BarleyDB, CeResDB and MilletGenes) • Forage grasses (FoggDB) • Potato (SpudBase) • as well as developing a database for: • Comparative mapping data (CropSeqDB and ComapDB)
Problems • To get hold of comparative mapping data from the crop plant community, we need to access disparate data sources of differing quality (not necessarily electronic). • We need to link the data sources to form a single, queriable entity.
The UK CropNet single- and related-species databases AGR BarleyDB SpudBase ARCADE MilletGenes BrassicaDB CerealsDB FoggDB ComapDB Will the GRID be a better solution than ARCADE?
Analysing chromosomal evolution CHROMTREE
Inversion Inversion Translocation Inversion Chromosomes evolve over time Mutations events can be mathematically modelled and used to construct a phylogenetic tree
Problems • Unlike DNA sequences, data are combinatorial, not linear. • Algorithms are very slow (many require optimisation over a multi-dimensional space) and analysis of large data sets is not currently possible on JIC machines. • Parallelisation of algorithms may help, as it has done for DNA sequence phylogenetic analysis. However, is the only answer? • In some cases (due to mutations such as allo-polyploidy) we may wish to consider phylogenetic networks instead of trees – an even harder computational problem.
Analysing germplasm collections GENE-MINE and GERMINATE
Germplasm projects • GENE-MINE: An EU-funded project to develop a data-management and analysis computer system for plant germplasm collections • GERMINATE: A BBSRC-funded project allied to GENE-MINE and another EU project TEGERM, to develop specialist tools for analysis of the TEGERM data. • The problems seen in these projects are essentially the same as those of UK CropNet and CHROMTREE.
Retrotransposon insertion 1 2 3 Like chromosomal mutations, retrotransposon insertion can be mathematically modelled
Relationship between accessions INS INS INS Again, sometimes we may need to estimate a phylogenetic network (due to introgression between accessions)