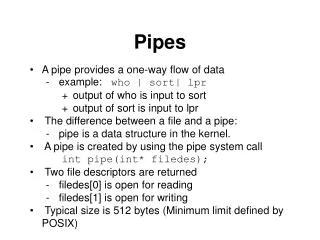
Download
1 / 29
290 likes | 416 Vues
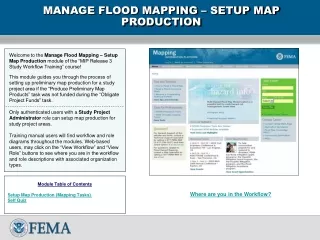
In this detailed overview by Steve Grisé, Solution Architect at Vertex3, we explore the multifaceted approach to production mapping within the York Region. This presentation covers project objectives, a data model review, process discussions, and the integration of GIS in planning, design, construction, and operations. Key topics include QA/QC processes, local participation in data management, asset planning, and the establishment of a regional GIS database that meets both local and broader regional needs. Best practices and future steps for improved data sharing and management are also discussed.

E N D
All PipesProduction Mapping Steve Grisé Solution Architect, Vertex3 October, 2012
Topics • Production Mapping Project Overview • Data Model Review and Discussion • Process Review and Discussion
Production Mapping In York Region Planning Design Construction Operations GIS GIS GIS GIS Processes Posting Job/Edit Session Editing Steps Job QA/QC
Regional Data Sharing Other Regions York Region Hydraulic Modeling regional All Pipes King Analysis and Reporting Whitchurch-Stouffville … GIS Processes Job/Edit Session Editing Steps Job QA/QC Posting QA/QC Extract
Production Mapping • Data Reviewer • QA/QC • Define Workflows • Job • Workflow steps and tools • Raise the bar for data quality and consistency • Distributed editing based on agreements
Drivers • Local Participation • Meet local business needs • Daily Operations • Summary – Reporting and Compliance • Asset Planning and Management • Regional needs met as a by-product of meeting local needs • Incentives and agreements will have some impact on data model/processes over time • What are your drivers?
Best Practices for W/WW • GIS updated from Drawings/As-Builts • Represents the asset in the organization • Often integrated • Asset Management – Reporting • Asset Management – Operations and Engineering • Network Analysis • Maturity • Data Model • Tools/Applications • Integration • Processes and Data Quality
What is a Data Model? • A representation of the real world in a computer system • Supports business applications and business functions • Defines the set of information products/information we can access • Defines the work that needs to be done to manage the information • An agreement with choices and decisions
Application-Driven Design • Define the information products required • Break down into layers, reports, others • Design datasets to support the layers • Best Practices are iterative 3 2 4 5 1
Purpose of the Data Model • Primary goal is to produce a regional GIS database • Region-wide • Current • Supports Integration • Managed in partnership with Local Area Municipalities (LAMs) • Enterprise Data Warehouse • What are your needs?
Content Review • Starting Point • Modeling Task Force at York Region • Existing GIS data/models • Existing Network Analysis data/models
Next Steps • Refine based on information products/needs • Driving forces • Asset Management at York Region • Asset Management for LAMs • Reporting requirements – MOE and others • Operations • Multi-jurisdictional issues like Inflow and Infiltration • All Pipes Model will be the core data structure that groups will extend for their purposes • … and possibly share at some point…
Regional Data Sharing A Export QA/QC B C A A B Load Export QA/QC B D F A Export QA/QC B E
Regional Data Sharing A B F Access By Partners
Challenges • Closest-to-source QA • One-touch editing • Quality, currency • Sustainment • Skill Sets • Resources
Next Steps • Review with stakeholders in different areas • Collaboration • Maximo-GIS integration • All Pipes Implementation pilot(s) • Data Model Refinement • Process and rules definition • Others based on your feedback • What do you want to see?
Outcomes Centralize data, provide easy access to partner organizations, reduce requests/efforts/redundancy Optimize Development activities in the Region so that new customers are located close to water/wastewater capacity Locate assets quickly and identify ownership/maintenance responsibilities Improve visibility into volume and billing data
Design Process • What map layers can I see and interact with? • Where does the Data come from? • What Impact is there on All Pipes sharing and Production Mapping work? Analysis and Planning Operations Assets Landbase
Possible Impacts • Need Customer Counts for Mains • Annual Consumption/Available capacity • Local Official Plans • Building Permits • Local self-reporting on G/Y/R • Identifying Properties with Development Potential/Priority ranking
Your Outcomes • What do you want to see? • What layers/data do you need? • Is there an impact on • Data warehouse • Data sharing • Process for you and partners • What information can you provide?
Current Situation in York Region • Data Status • Completeness • Currency • Content • Many good people have worked hard to get to this point • The Region and partners are spending significant $ on data • Lots of work to be done