Download
1 / 1
10 likes | 99 Vues
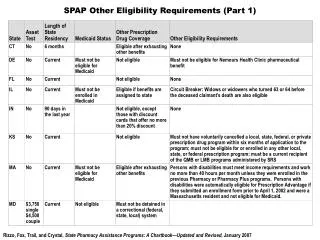
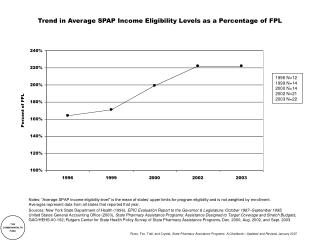
This study analyzes the trend in average SPAP income eligibility levels from 1996 to 2003. The data represents upper limits for program eligibility across states. Sources include reports from various health departments and surveys.

E N D
THE COMMONWEALTH FUND Trend in Average SPAP Income Eligibility Levels as a Percentage of FPL 1996 N=12 1999 N=14 2000 N=14 2002 N=21 2003 N=22 Notes: “Average SPAP income eligibility level” is the mean of states’ upper limits for program eligibility and is not weighted by enrollment.Averages represent data from all states that reported that year. Sources: New York State Department of Health (1996), EPIC Evaluation Report to the Governor & Legislature: October 1987–September 1995;United States General Accounting Office (2000), State Pharmacy Assistance Programs: Assistance Designed to Target Coverage and Stretch Budgets, GAO/HEHS-00-162; Rutgers Center for State Health Policy Survey of State Pharmacy Assistance Programs, Dec. 2000, Aug. 2002, and Sept. 2003. Rizzo, Fox, Trail, and Crystal, State Pharmacy Assistance Programs: A Chartbook—Updated and Revised, January 2007