Download
1 / 12
120 likes | 216 Vues
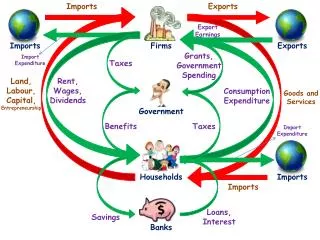
Households Below Average Income. 23 rd April 2007 Presentation at FRS User Group Meeting By Nick Herbert - DWP. Topics to be covered. HBAI coverage What does HBAI aim to measure ? Equivalisation SPI adjustment Grossing HBAI publication Typical questions that are asked. HBAI coverage.

E N D
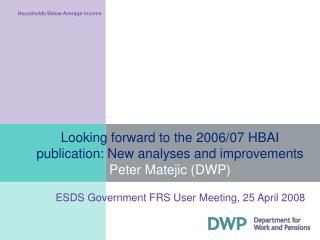
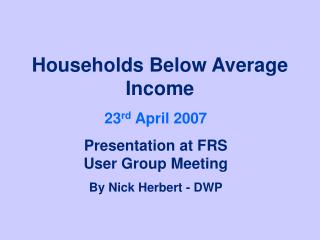
Households Below Average Income 23rd April 2007 Presentation at FRS User Group Meeting By Nick Herbert - DWP
Topics to be covered • HBAI coverage • What does HBAI aim to measure ? • Equivalisation • SPI adjustment • Grossing • HBAI publication • Typical questions that are asked
HBAI coverage • Private households in United Kingdom • Main data source is - DWP Family Resources Survey • Measurement of living standards as determined by the net disposable household income • Incomes equivalised and analysed Before and After Housing Costs (BHC and AHC)
What does HBAI measure ? • HBAI uses household disposable incomes, after adjusting for household composition, as proxy for material living standards • Uses OECD equivalisation scales, rather than McClements • The baseline year, for absolute low income, is 1998/99 • Material deprivation is now reported on
Equivalisation • Takes into account the size and composition of the household • Equivalisation scales take a couple with no children as a reference point • Use OECD scales, which are consistent with EU • The factors are applied to the data
The income distribution in 2004/05 (BHC) Median income £349pw 60 per cent median £210pw Mean income £427pw 2.1 million individuals with income above £1000 per week 1 2 4 5 6 8 7 9 3 10
SPI adjustment • An adjustment is made to sample cases at the top of the income distribution to correct for volatility in the FRS • Uses data from Survey of Personal Incomes (SPI) from HMRC • The “very rich” are assigned income from SPI • Adjustment is made separately for pensioners and non-pensioners
Grossing • Apply factors to the sample data to give estimates which represent overall private household population • Control totals are applied, for males and females by age-band, by region • Other control totals are number of lone parents, tenure type and Council Tax band
HBAI - annual publication • HBAI is published annually, in the spring • It is a high-profile DWP publication • Reports upon the department’s child poverty targets • It also provides poverty measures for working-age adults and pensioners • Provides some inequality measures
Customers and queries • Main customers; policy colleagues in DWP, HM Treasury, Scottish Executive, academics • Typical questions; what is the number of people in low income by region, by ethnic group, by disability status, by number of children • Also, of course, get questions on changes over the years