Effective Presentation Design: Moving Beyond PowerPoint Defaults
430 likes | 558 Vues
This presentation explores the limitations of traditional PowerPoint slide design and advocates for the assertion-evidence structure, grounded in communication research. Drawing on studies from Tufte, Alley, and others, it highlights how excessive text and crowded slides hinder audience understanding. The assertion-evidence approach encourages succinct headlines supported by visual evidence. By transforming standard slides into this more effective format, presenters can enhance communication clarity and engagement. Join us to learn about practical strategies for improving your presentations.

Effective Presentation Design: Moving Beyond PowerPoint Defaults
E N D
Presentation Transcript
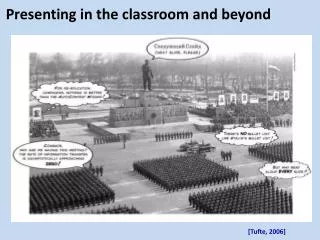
Presenting in the classroom and beyond • [Tufte, 2006]
Understanding follows from dividing out what’s relevant and minimizing use of jargons and excessive text (bullets) • [Marshall, 2012]
Rethinking the Designof Presentation Slides • Michael Alley • College of Engineering • Melissa Marshall • Department of Communication Arts & Sciences • [Hamaker, 2009]
The defaults of PowerPoint are not based on researchin communication or cognitive psychology • Poor starting place • [Gomes, 2007]
Our research has found that most slides are heavily influenced by these defaults • 40% • Too much text • [Garner et al., 2009]
Our research has found that most slides are heavily influenced by these defaults • 25% • Too much text: crowded • [Garner et al., 2009]
January 24, 2003 • February 1, 2003 • The past few years, this common practice of PowerPoint has received harsh criticism • January 16, 2003 • [Tufte, 2003] • [Schwartz, 2003] • [Keller, 2003]
2005 • Several recent texts have challenged the defaults of PowerPoint • 2003 • 2008
We advocate an assertion–evidence slide structure that is grounded in communication research • [Fishbone, 2008]
Xenon headlights illuminate signs better than halogen headlights do • Standard Halogen • Xenon • Halogen Headlight • SilverStar Ultra TM • Xenon Headlight • [Sylvania, 2008 ]
The structure calls for a succinct sentence headline that states the main assertion of the slide • [Toulmin, 2002] • [Alley et al., 2006] • [Sawarynski, 2009]
The small size of the mouse brain makes locating specific areas extremely difficult • [Welker, 2008]
The structure also calls for supporting that sentence-assertion headline with visual evidence • [Mayer, 2001] • [Paivio, 1986] • [Brown, 2008]
During growth, cells secrete waste products and macromolecules into their environment • Waste • Macromolecules • Cells
The Chesapeake Bay, which is the country’s largest estuary, has only two places for traffic to cross • sha.state.md.us • [roadtraffic-technology.com] • Annapolis • Dover • Washington D.C • Richmond • [landsat.gsfc.nasa.gov]
In the past 25 years, traffic has significantly increased on the Chesapeake Bay Bridge • 1961 • Traffic 1.5 million • 2007 • Traffic: 27 Million • 1952 • Traffic: 1.1 million • [Maryland Transportation Authority, 2007]
At typical highway speeds, overcoming drag requires about two-thirds of a truck engine’s output [McCallen, 2004] • [LLNL, 2010] • How much power from a truck’s engine is needed to overcome aerodynamic drag? • Aerodynamic Drag • CD = 0.6 • Rolling Friction and Accessories
[Alley, 2003] • [Atkinson, 2005] • A third hurdle in adopting the assertion−evidence structure is to overcome the weak defaults of PowerPoint • Template at first Google listing for “presentation slides”
In summary, assertion-evidence slides are more effective than the common practice of PowerPoint • [Hamaker, 2009]
Example transformations of slides from the traditional to the assertion-evidence design • Melissa Marshall • Department of Communication Arts & Sciences
This presentation shows transformations of slides from the traditional to the assertion-evidence design • Before • After
A First Step • Towards Automatic Verification • of PDE Code • Hans Petter Langtangen • Ola Skaghaug • Simula Research Laboratory • Oslo, Norway • Before
A First Step Towards Automatic • Verification of PDE Code • Hans Petter Langtangen • Ola Skaghaug • Simula Research Laboratory • Oslo, Norway
somewhatmanual • Python • MATLAB • automated • This presentation shows the evolution from a manual environment to one that is automated • Fortran 77 • C++ • manual
This presentation compares methods for reducing emissions of sulfur dioxide from coal power plants
Converting an analog signal to a digital signal requires a sampling of the signal • Hardware converts analog signal to digital • Accelerometer outputs an analog voltage • Computer samples a number of points • Data is exported to popular applications • Excel
Validation • Verification • Is the PDE model appropriate? • Do we solve the right equations? • Are the numerical models correctly implemented? • Do we solve the right equations? • Although researchers give validation more attention, validation requires successful verification
Iron • An abundant metal, makes up 5.6% of earth’s crust • Properties: • shaped, sharpened, welded • strong, durable • Accounts for >95% of metals used • Iron ores discovered in 1844 in Michigan’s Upper Peninsula • Soon found other ores in upper Wisconsin and Minnesota • Iron Ore Distribution • Before • Kesler 1994
Iron Is strong and durable Can be shaped, sharpened, and welded • Iron ores make up 5.6% of the earth’s crustand account for 95% of the metals used Where is the largest concentration of iron ores in North America? • Iron ore • [www.star-bits.com] • Iron Ore Distribution • [Kesler 1994]
Students learning from the transformed slide scored higher on an identical test question • Q: How abundant is iron in the earth’s crust? • Led to 59% recall • Led to 77% recall • p < 0.001 • [Alley et al.,2006]
Although the U.S. has 5% of the world's population, we use an average of 30% of all resources • United States use of specific resources • (percentage of worldwide use)
Students learning from the transformed slide scored higher on an identical test question • Q: Percentage of world’s resources that the U.S. uses? • Led to 71% correct • Led to 82% correct • p < 0.025 • [Alley et al.,2006]
Uranium and Thorium are large “unstable” atoms break down to produce smaller atoms, heat, and radioactivity • Plates move because of convection caused by heat from decay of radioactive elements in the mantle • Ocean • [Miller, 2004]
Students learning from the transformed slide scored higher on an identical test question • Q: Heat source for movement of lithospheric plates? • Led to 54% correct • Led to 86% correct • p < .001 • [Alley et al.,2006]
Fossil Fuels: Who has what? • Before
Students learning from the transformed slide scored higher on an identical test question • Q: Percentage of oil that non-OPEC countries control? • Led to 63% correct • Led to 81% correct • p < .001 • [Alley et al.,2006]