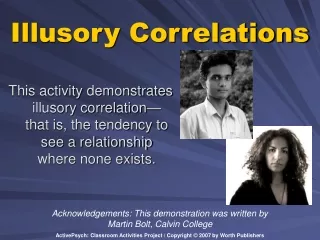
Illusory Patterns
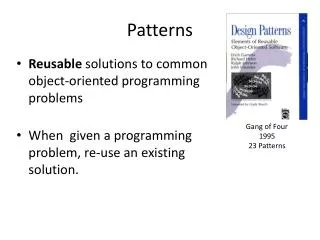
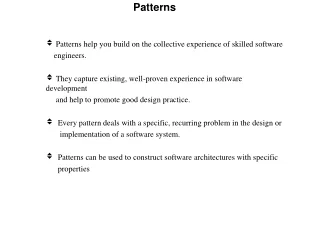
Illusory Patterns. CCC8001. Patterns. Pattern Recognition. Seeing patterns in your data is a good thing, and humans are natural pattern finders. Watson & Crick discovered the structure of DNA by recognizing the “fuzzy X” pattern it left when bombarded with X-rays. Pattern Recognition.


Illusory Patterns
E N D
Presentation Transcript
Illusory Patterns CCC8001
Pattern Recognition Seeing patterns in your data is a good thing, and humans are natural pattern finders. Watson & Crick discovered the structure of DNA by recognizing the “fuzzy X” pattern it left when bombarded with X-rays.
Pattern Recognition But sometimes we see patterns when there’s really nothing to see. Consider this famous photograph from 1976 by the Viking I spacecraft. Look! A face on the surface of mars!
Pattern Recognition But sometimes we see patterns when there’s really nothing to see. But this was what we were seeing…
Human Pattern Recognition Some people think that these images are evidence of God, and communication from God. But humans are really good at seeing patterns, especially faces, even when they aren’t there:)
Aliens! Here’s something from the Telegraph, the third most visited newspaper site in Britain: Alien life found living in Earth's atmosphere, claims scientist Aliens do exist and have been found living in the clouds above the Peak District, according to new claims by scientists.
Unsurprisingly… The “scientific” research supporting this finding was published in The Journal of Cosmology. The JoC is a predatory open access journal that publishes bad research in exchange for author fees. It is known for publishing fringe viewpoints and bad science.
EVP Some people think that Electronic Voice Phenomena (EVP)– “voices” that can be heard on very sensitive recording equipement– are evidence of communication from the dead or spirits. Another explanation: random sounds in “noise” seem like voices to us.
Conspiracy Theories Conspiracy theories may be like pareidolia and EVP. Not patterns in sights or sounds that we see (but aren’t there)– but instead patterns in events.
Why do we see extra patterns? Our brains are very good at finding patterns when they exist, and this is important. But part of our success comes by seeing patterns everywhere, even when they don’t exist, including in random data.
Priming What you see (or hear) is partly a result of what you expect to see or hear. Your mind fills in gaps or holes in what you see/ hear with what it thinks should be there.
Color Vision “Ask a friend to stand in front of you, and you look directly at her nose, without moving your eyes. She takes a bunch of colored pencils and brings them in slowly from the side. You try to say what colors the pencils are, and in what order they are arranged…”
Color Vision “You'll find that you're quite incapable of doing this task, even if she holds the pencils as close as right next to her ear. You may be able to see a red pencil, but you'll certainly miss most of the colors, and you definitely will get the order wrong.”
O Fortuna– Misheard Lyrics Bad Lip Reading– Hunger Games? Rebecca Black?
The Clustering Illusion I flipped a coin (really!) 20 times in a row. ‘X’ is Queen Elizabeth II and ‘O’ is the lion with the crown. Here is what I got: XXXXOOXOOXXOOXOOXOOO
The Clustering Illusion I flipped a coin (really!) 20 times in a row. ‘X’ is Queen Elizabeth II and ‘O’ is the lion with the crown. Here is what I got: XXXXOOXOOXXOOXOOXOOO That doesn’t look random. But it is. The coin lands the same as the previous toss 10 times and different from the previous toss 9 times.
The Clustering Illusion I flipped a coin (really!) 20 times in a row. ‘X’ is Queen Elizabeth II and ‘O’ is the lion with the crown. Here is what I got: XXXXOOXOOXXOOXOOXOOO That doesn’t look random. But it is. The coin lands the same as the previous toss 10 times and different from the previous toss 9 times.
The Clustering Illusion Ask anyone who watches basketball whether this is true: “If a player makes a shot, they’re more likely to make the next; if they miss a shot, they’re less likely to make the next.”
The Clustering Illusion Most people will say ‘yes, of course’. But it’s not true, they’re subject to the clustering illusion. Gilovich, Vallone & Tversky (1985) analyzed records of made and missed shots, and they found:
The Clustering Illusion • Players who made a shot, on average, scored on the very next shot 51% of the time. • Players who missed a shot, on average, scored on the very next shot 54% of the time. • Players who made two shots in a row, scored on the very next shot 50% of the time. • Players who missed two shots in a row, scored on the very next shot 53% of the time.
Small Samples Another reason why we see patterns that aren’t there is that we fail to recognize that small samples have more variation than large ones. If I eat at a restaurant once and it has bad food, I conclude that it’s bad and that the food is bad. But even great restaurants have bad food once in a while!
Adding Explanations Often, when people see a pattern (even one that isn’t real) they try to explain it. Once they have an explanation, it can become very difficult to convince them that the pattern is fake. “I know players shoot better after making a shot– this gives them confidence to make another.”
Variables • Height • Profit • Spiciness • Time • Speed • Intelligence • Hours worked
Perfect Correlation We say that two variables are perfectly correlated when knowing the value of one variable allows you to know the value of the other variable with certainty. R = 1 or R = -1. For example, the area of a triangle whose base is 5 (one variable) is perfectly correlated with the height of the triangle (another variable).
Imperfect Correlation Two variables are imperfectly correlated when the value of one gives you some evidence about the value of the other. For example height of parents (one variable) is imperfectly correlated with height of children (another variable). Tall parents have tall children, on average, and short parents have short children, on average.
Regression to the Mean Whenever two variables are imperfectly correlated, extreme values of one variable tend to be paired with less extreme values of the other. Tall parents have tall children, but the children tend to be less tall than the parents. Students who do very well on Exam 1 tend to do well on Exam 2, but not as well as they did on Exam 1.
Regression to the Mean This is true of any two imperfectly correlated variables. Companies that do very well one year on average do well the next year, but not quite as well as the previous. Students who do well in high school on average do well in college, but not as well as in high school.
Regression to the Mean “Regression” just means going back, and “mean” means average. “Regression to the mean” is just a fancy way of saying going back to average.
Imperfect Correlation If I flip a fair coin and ten times in a row it lands heads each time, it will not“regress to the mean” and land tails more than heads to balance things out. Since it’s a fair coin, it is most likely to land heads half the times and tails the other half. Future tosses of a coin are independent of past ones. Fair coins land, on average, 50% heads and 50% tails.
Imperfect Correlation Regression to the mean happens when we have two imperfectly correlated variables X and Y, and X takes on a very extreme value. Then we expect Y to take on a less extreme value. But coin flips are not imperfectly correlated. They are not correlated at all. Past coin flips do not influence future coin flips.
Group Effect It’s important to note that regression to the mean is not an individual effect. If you score low on the first exam you can’t assume you will do better next time. What you can assume is that if you take the group of all who did poorly and then test them again, the average score will be closer to the mean.
Not Causal It’s also important to note that regression to the mean is not a causal relation between variables. If I give an exam, there will be some random variation– some measure of “luck.” Imagine that I’m going to give an exam with 5 questions on it. I give all the students 10 questions to study, and for each exam, I randomly select 5 of those 10 questions for the exam.
What the Students Study Now imagine that each student studies only 5 of the possible questions. So each student knows the same amount– half of the material. Intuitively, each student “deserves” the same grade.
Giving the Exam But now imagine that I give an exam, randomly selecting 5 questions. On average, students will know the answers to 2.5 of the questions, since on average they know half of the material. But some students will be “lucky”– I will pick only the questions they studied, and they will get 5/5. Other students will be unlucky: I will pick only the questions they didn’t study. Everyone else will be in the middle.
Regression to the Mean But if I give a second exam, we will see regression to the mean. The lucky students on the first exam probably won’t be the lucky ones on the second. The same goes for the unlucky students. So the lucky students on exam #1 will get worse grades on exam #2 (on average), and the unlucky students on #1 will get better grades on #2 (on average). Their grades regressed to the mean (2.5).