Download
1 / 51
510 likes | 670 Vues
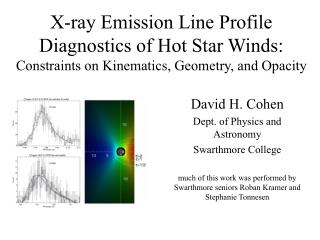
X-ray Emission Line Profile Diagnostics of Hot Star Winds: Constraints on Kinematics, Geometry, and Opacity. David H. Cohen Dept. of Physics and Astronomy Swarthmore College much of this work was performed by Swarthmore seniors Roban Kramer and Stephanie Tonnesen. Outline.

E N D
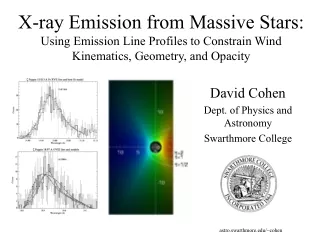
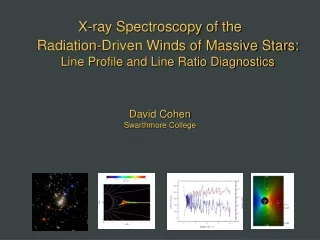
X-ray Emission Line Profile Diagnostics of Hot Star Winds: Constraints on Kinematics, Geometry, and Opacity David H. Cohen Dept. of Physics and Astronomy Swarthmore College much of this work was performed by Swarthmore seniors Roban Kramer and Stephanie Tonnesen
Outline • What are the x-rays we see? • What do the observations look like? • What trends emerge, and how can the properties of the individual stars and of the trends among lines and among stars be explained by the physical effects we expect might be present? • z Pup: wind x-rays, but less absorption than expected • z Ori and d Ori: similar situation, very little wind absorption; but wind-shock parameters are otherwise satisfactory • Magnetic O stars and B stars are a different story: q1 Ori C, t Sco, b Cru
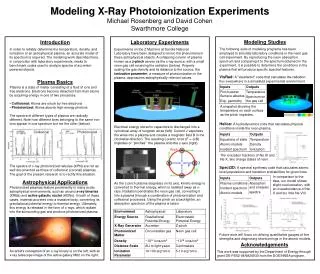
X-rays from normal stars are traditionally assumed to obey the coronal approximation: They’re thermal line emission from a low-density, optically thin, steady-state plasma in which the ionization balance is governed by collisional ionization and radiative and dielectronic recombination. Collisional excitation and spontaneous emission are the only important atomic processes between bound states. The line emission we see is from spontaneous emission following collisional excitation from the ground state (the x-ray emission is a cooling process) Some recombination and free-free continuum emission can be present too.
The coronal approximation paradigm was inspired by the Sun and solar-type cool stars • But, it’s assumed to also apply to hot stars • Potential difficulties include • - Lines that may be optically thick to scattering • - Non-equilibrium ionization (seen in the sun, locally-flares) may be a bigger issue in wind-shock sources, where the plasma is moving rapidly…recombination and cooling times are of order 103 to 104 seconds, as are flow times. • - Excitation out of excited states can be important for metastable levels (e.g. forbidden lines in helium-like ions) • - The X-ray radiation field can have important effects on the bulk cool wind component in hot stars
In the coronal approximation, line strengths are a function almost exclusively of plasma temperature1,2(density-dependence of collisional ionization and radiative recombination is the same, so density effects cancel out for the most part) We see, characteristically, the Lyman series and He-like lines of abundant elements: nitrogen through sulfur (Z=7 - 14), and L-shell3 lines of iron (between 11 and 17 Å) 1Elemental abundance plays an important role too 2Emissivities of individual lines are fairly strongly peaked in temperature, with characteristic widths of 0.3 dex. 3L-shell refers to transitions to the n=2 level (so Li-like to Ne-like ground states)
In OB stars, we see basically the same lines1 but the resolved shapes of these lines provide information about the plasma kinematics and, via continuum absorption by the cold bulk wind2, about the spatial distribution of the plasma. 24 Å 12 Å The wavelength dependence of individual lines leads to the expectation that different absorption characteristics will be seen in different lines from a given star. The temperature dependence of individual lines can potentially provide information about the kinematics and location of different plasma temperature components. O K-shell edges 1Significant continuum emission will only be seen in plasma with temperatures above about 20 X 106 K 2Photoelectric absorption due to K-shell (“inner-shell”) photoionization is the dominant proces
Chandra and XMM, launched in 1999, are the first instruments to allow for the measurement of resolved x-ray emission lines* The resolution of the Chandra medium energy grating (MEG) is .023 Å FWHM: l/Dl ~1000 at 23 Å (300 km s-1) The effective area is only a few square centimeters *The EUVE spectrometers measured emission lines from the B2 II star e CMa.
The Chandra Archive of Hot Stars Because of the pathetically small effective area of the gratings, only a handful of single OB stars can produce high-quality spectra -- we will look at those single OB stars* that are publicly available (or have been published). *HD206267, i Ori, t Cma, other stars in the q1 Ori system, and several interacting binaries, h Carina, and WR stars have been observed too, and there are a few more hot stars recently observed or proposed for observation with the Chandra gratings (Cyg OB2 no.8). But the total number ofeffectively single OB stars for which Chandra will produce high-quality grating spectra is probably less than a dozen.
Global appearance of spectra (Chandra MEG) • Pup (O4 I) q1Ori C (O7 V) • Ori (O9.5 II) • Sco (B0 V) • Cru (B0.5 IV) • Ori (O9.7 I) 10 Å 20 Å 10 Å 20 Å
Focus in on a characteristic portion of the spectrum 15Å 12Å 12Å 15Å • Pup (O4 I) q1Ori C (O7 V) • Sco (B0 V) • Ori (O9.5 II) dOri (O9.7 I) • Cru (B0.5 IV) Ne X Ne X Ne IX Fe XVII Ne IX Fe XVII There is clearly a range of line profile morphologies from star to star
Differences in the line shapes become apparent when we look at a single line (here Ne X, Lya) zPup q1Ori C gCas tSco zOri AB Dor (K1 IIIp) dOri bCru Capella (G2 III)
Now let’s focus on individual lines • Pup: prototypical O supergiant wind We can look at the line profiles non-parametrically: are they blueshifted? asymmetric? We calculate the first four moments of each line profile: the first moment is proportional to the wavelength shift while the third moment, the skewness, is an indicator of asymmetry.
Our idea: fit lines with the simplest model that can do the job, and use one that, while based in physics, is general in the sense that any number of physical models can be tested or constrained based on the model fits. From Owocki & Cohen (2001): spherically symmetric, two-fluid (hot plasma is interspersed in the cold, x-ray absorbing bulk wind); beta velocity law. Visualizations of the wind use hue to indicate line-of-sight velocity and saturation to indicate emissivity; corresponding profiles are plotted vs. scaled velocity where x = -1,1 correspond to the terminal velocity.
The model has four parameters: Ro=1.5 for r>Ro Ro=3 where The line profile is calculated from: Ro=10 Increasing Ro makes lines broader; increasing t* makes them more blueshifted and skewed. t=1,2,4
We fit all the (8) unblended strong lines in the Chandra spectrum of z Pup: all the fits are statistically good Ne X 12.13 Å Fe XVII 15.01 Å Fe XVII 16.78 Å N VII 24.78 Å Fe XVII 17.05 Å O VIII 18.97 Å
We place uncertainties on the derived model parameters lowest t* best t* highest t* Here we show the best-fit model to the O VIII line and two models that are marginally (at the 95% limit) consistent with the data; they are the models with the highest and lowestt* values possible.
To find the parameter uncertainties, we calculate models on a grid in parameter space. Displayed grids are slices of constant t*, with the best fit line profile in each slice shown to the right. Note the parameter uo =1/Ro
Graphical depiction of the best fit (black circles) and 95% confidence limits (gray triangles) on the three fitted parameters for seven of the lines in the z Pup spectrum. q Ro t*
Lines are well fit by our four parameter model (b is actually held constant at b=1; so three free parameters): z Pup’s x-ray lines are consistent with a spatially distributed, spherically symmetric, radially accelerating wind scenario, with reasonable parameters: • t*~1 :4 to 15 times less than predicted • Ro~1.5 • q~0 • But, the level of wind absorption is significantly below what’s expected. • And, there’s no significant wavelength dependence of the optical depth (or any parameters).
Ro of several tenths of a stellar radius is expected based on numerical simulations of the line-force instability (self-excited on the left; sound wave purturbations at the base of the wind on the right)
We do expect some wavelength dependence of the cross sections (and thus of the wind optical depth), BUT the lines we fit cover only a modest range of wavelengths. And in the case of z Pup, nitrogen overabundance (not in calculation shown at right) could flatten out the wavelength dependence even more. OR perhaps clumping plays a role. And clumping certainly could play a role in the overall reduction of wind optical depth. Wind opacity for canonical B star abundances. N K-edge Note: dotted line is interstellar.
Do the other O supergiants, z Ori and d Ori, fit into the wind-shock paradigm? The Ne X line in z Ori (left) is skewed and blueshifted (>1s), though not as much as the same line in z Pup (below)
The strong lines in these other O supergiants can also be fit by the simple spherically symmetric wind model dOri Fe XVII 15.01 Å zOri O VIII 18.97 Å t*=0 t*=0.4 Though they are clearly less asymmetric and a little narrower
Best-fit t* values are a few tenths, although a value of zero can be ruled out at the 95% confidence limit in all but one line…however, values above 0.5 or even 1 cannot be ruled out in most cases dOri zOri
Ro, the radius of the onset of X-ray emission is within the first stellar radius above the photosphere; and consistent with a height of 3/10 R* or less at the 95% confidence level for all the lines dOri zOri It’s these small Ro values that produce the relative narrowness of the lines (compared to z Pup).
q, the power-law index describing the radial dependence of the x-ray emissivity, is more or less consistent with zero dOri zOri
There are correlations among the model parameters zOri Fe XVII 15.013 Å Ro=1 Ro=2 Ro=2 Ro=1 Bigger q goes with bigger Ro (left) Higher t goes with lower Ro (right)
What about the stars with the harder X-rays and narrower lines: q1 Ori C and t Sco? t Sco’s Ne X line overplotted with a delta function model. Capella t Sco z Pup The lines in t Sco look more like those in coronal sources…and the lines in q1 Ori C aren’t a whole lot broader.
Narrow(ish) and symmetric lines…due to line scattering? The symmetrizing and narrowing effects of line scattering are really only significant for constant velocity winds (here, reproduced by large Ro)
Can narrow(ish) lines be explained by slow wind acceleration? You only need b~2 to make lines in z Pup as narrow as the Chandra resolution.
But the large x-ray luminosities and hard x-ray spectra already argue against instability-generated shocks… …and suggest that a hybrid wind-magnetic model might be appropriate, especially on q1 Ori C, on which an 1100 G dipole field has been discovered ud-Doula and Owocki (2001) have performed MHD simulations of magnetically channelled winds: Equatorward flow inside closed field lines and associated strong shocks are seen. y-component of velocity
ud-Doula has made models specific to q1 Ori C, and included radiative cooling for the first time: This is a movie of density, evolving from an initial spherically symmetric steady-state wind.
We looked at some snapshots from these simulations and synthesized line profiles (and emission measure distributions and light curves) This first snapshot of q1 Ori C is from a time when the hot plasma is relatively placid, filling the closed loop region speed density temperature Note: throughout, the speed is in terms of an assumed terminal speed of 2500 km s-1
The geometry and viewing angle are relatively well established for this star. There is a 45tilt between the rotation axis and both the magnetic axis and the direction of the Earth: we see a full range of viewing angles of the magnetosphere, and have Chandra observations for four of them.
We thus synthesize line profiles for a range of viewing angles Here we show 0, looking down the magnetic axis Color contours are now line-of-sight velocity; and the black contours enclose plasma with T > 106 K The profile is very narrow
Two other viewing angles from the same hydro snapshot (45, 90 )
Snapshots from another time in the MHD simulations -- one with material falling back onto the star from the closed field region -- shows similarly narrow lines speed density temperature
Line profiles and Line-of-Sight Velocities The lines are similarly narrow in this snapshot, with the disk infall…
The lines are narrow from all viewing angles…only slightly exceeding the instrumental resolution. Range of vel. Widths seen in other O stars Line widths synthesized from MHD simulation Observed range in q1 Ori C at four observed viewing angles
Overall x-ray modulation with rotation phase (alternately, viewing angle of magnetic axis) is well reproduced by the MHD models (solid line; data are colored symbols, with longer wavelength lines purple and short wavelength lines green).
Constellation-X will have better resolution than Chandra only at high energies…but its effective area will be 1000 times bigger This “minimum velocity” is 1/5 the FWHM resolution
Conclusions • There is a relatively wide variety of line profile morphologies seen in Chandra observations of OB stars • Spherically symmetric, wind-shock models fit most O stars adequately • But mean wind optical depths are low • There are some anomalous stars with narrow lines and/or very hard spectra…hybrid wind-magnetic models are promising • B stars have narrow lines; but still might be consistent with the wind-shock scenario if the wind acceleration is slow or the onset radius of x-rays is close to the photosphere
g Cas AB Dor Capella
Line centroids from MHD agree well with observed values for q1 Ori C