Transcriptomics
Transcriptomics. Jiri Zavadil , PhD Molecular Mechanisms and Biomarkers International Agency for Research on Cancer, Lyon. Transcriptomics - Definitions. Transcriptome - the complete set of RNA transcripts produced by the genome at a given time


Transcriptomics
E N D
Presentation Transcript
Transcriptomics Jiri Zavadil, PhD MolecularMechanisms and Biomarkers International Agency for Research on Cancer, Lyon
Transcriptomics - Definitions Transcriptome - the complete set of RNA transcripts produced by the genome at a given time Transcriptomeis highly dynamicand complex in comparison to the relatively stable genome Transcriptomics- the global study of gene expression at the RNA level - can include genes for ncRNAs (microRNAs etc)
Biospecimens in I4C Mother-Child and Infant-Child Cohorts Blood spots Cordblood Wholeblood Genetic, epigenetic, transcriptomic analyses (nucleicacids) Proteomicanalysis, serological and chemical analyses Urine Chemical, proteomic and nucleicacidanalysis Tumorcells, tissues
Case for Integrated Omics Analyses The prospective biospecimen collection and retrospective case analysiswillyieldinterconnectedresults Epigenetics generegulation RNA and proteinmarkers DNA methylation Histone modification Studied by transcriptomics
Transcriptomics – Applications for I4C Specific gene expression Genes and signatures determined by particular genetic, epigenetic regulatory factors, environmental exposures Exploratory approaches Not hypothesis driven, e.g global gene expression in tumors versus healthy tissues, differential responses to distinct environmental exposures Disease etiology and classification Patterns/signatures rather than single markers can improve knowledge about etiology and diagnosis
DNA Microarray Platforms Illumina BeadArray Affymetrix GeneChip Workflow Reverse transcription, IVT with labeled nucleotides, array hybridization, staining, washing scanning Pros/Cons Rapid and streamlined protocols, standardized analysis; biased target collection, levels but limited sequence information
MicroRNA - TaqMan Low Density Array Total RNA Sample ABI 7900 SDS HT miRNA TLDA Array 742 total target miRs Quantile Normalization Pros/Cons Quantitative abundance analysis; biased target collection
Integrated Molecular Profiling By MPS Cancer Genome Sequencing Massively Parallel Sequencing (MPS) - powerful nucleic acid analysis tool providing base-pair resolution information at the genome scale Stratton, MR. Science 331, 1553 (2011)
Massively Parallel Sequencing emPCR ABI SOLiD 5500 Accuracy < 99.99% Throughput/Day <10–15 Gb Throughput/Run <90 Gb or >1.4 B reads (paired-end or mate-paired runs) Samples/Run • 1 genome • 12 exomes • 6 transcriptomes
Massively Parallel Sequencing Bridge amplification, clonal expansion Illumina HiSeq2000/2500 6 human genomes at 30x 64 transcriptomesat 20M mappedreads/sample
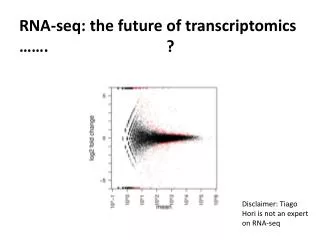
mRNA Abundance Analysis RPKM (Reads Per Kilobase per Million mapped reads) FPKM (Fragments Per Kilobase per Million mapped reads) Methods of quantifying gene expression levels from RNA-seq data by normalizing for total read length and the number of sequencing reads or fragments (PE reads). Unnormalized data Scaling Normalization Quantile Normalization -4 -2 0 2 4 -4 -2 0 2 4 -4 -2 0 2 4 log2(RPKM) A1 A2 A3 A1 A2 A3 A1 A2 A3 Identical distribution (spread, range and median) Equivalent distribution
Differential mRNA Abundance Analysis ACSL5 – normalized differential abundance ratio = 8.4
Single Nucleotide Variant Analysis DNA RNA Non-syn SNV/mutation identified at both DNA/RNA levels
mRNA Splicing Aberrations Acceptor Splice Sites Mutated in UUC 5’ GU------A-----AG 3’ Exon N Exon N+1 Tumor RNA Tumor DNA Normal DNA
Stage-Specific RNA Aberrations in ALL • 6 matched diagnosis/relapse pediatric ALL samples (n=12) • RNA-seq to discover novel mutations specific to relapse disease • Targeted ampliconresequencing at ultra-deep coverage
Solutions for Low Yield Samples • Microarray and RNA-seqTranscriptomeProfiling • Possible with >10 picograms total RNA • Degraded samples, RIN scores >2.0 • Formalin-fixed, paraffin-embedded (FFPE) samples • Whole blood • Direct cell lysate from the equivalent of a single or a few cells • microRNAProfiling • megaplex amplification protocols - 1-350 ng total RNA • non- amplification based for 350 – 1000 ng total RNA
The Future of MPS-based OMICS MPS cost goes down, technologies become more advanced and powerful, platforms develop rapidly – a strong case for transcriptomics within integrated omics approaches applied to large cohorts such as I4C. The Economist, 2011
Considerations for I4C Transcriptomics • Lowyieldsamples • (blood spots, extracellularmicroRNAs) mightrequire application of amplification methods • Tissue and cellspecificityof gene expression (e.g. cordblood vs leukemic clone) – need for carefullymatchedcontrols • Onlygenes and RNAsexpressedat the time of sampling are detected • Depth of coverageneedsfor RNAseq affect cost-relateddecisions • Specificdisease progression stages mightmasketiology-associated aberrations • Bioinformatics– limited standards for complex data processing and analysis (RNAseq), more benchmarkingstudiesneededusing data from consortia-like efforts (FDA’s SEQC). Data storage and access solutions.