Download
1 / 24
240 likes | 391 Vues
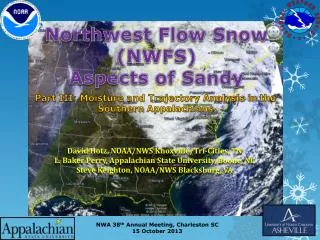
Northwest Flow Snow (NWFS) Aspects of Sandy. David Hotz, NOAA/NWS Knoxville/Tri-Cities, TN L. Baker Perry, Appalachian State University, Boone, NC Steve Keighton , NOAA/NWS Blacksburg, VA. Part III : Moisture and Trajectory Analysis in the Southern Appalachians.

E N D
Northwest Flow Snow (NWFS) Aspects of Sandy • David Hotz, NOAA/NWS Knoxville/Tri-Cities, TN • L. Baker Perry, Appalachian State University, Boone, NC • Steve Keighton, NOAA/NWS Blacksburg, VA Part III: Moisture and Trajectory Analysis in the Southern Appalachians NWA 38th Annual Meeting, Charleston SC 15 October 2013
NWFS Aspects of Sandy4-part Series • Part I: A General Overview of NWFS in the Southern Appalachians • Part II: A Unique Synoptic Setting for the Production of Northwest Flow Snow • Part III: Moisture Anomalies and Trajectory Analysis • Part IV: Radar and Satellite Observations
NWFS Aspects of SandyPart 3: Moisture and Trajectory Analysis in the Southern Appalachians Outline • To gain greater insight as to how unusual the Northwest Flow Snowfall (NWFS) associated with Sandy was compared to more typical NWFS events. • To conduct a detailed study of the moisture distribution and atmospheric flow in the lower and mid-troposphere during the event, and compared to more typical NWFS events. • To compare the trajectory and moisture sources with Sandy compared to more typical NWFS events.
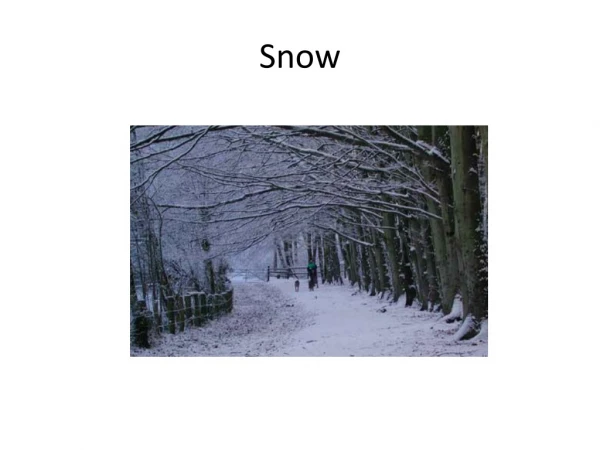
Trees that appear as crystalized pillars of ice on Mount LeConte, Tennessee (Smoky Mountains) after the record breaking snowfall of 33 inches. Snow drifts of 5 to 6 feet were reported at the lodge. Pictures courtesy of Allyson Verden.
Synoptic Climatology of Northwest Flow SnowfallL. Baker Perry, Appalachian State University, Boone, NC Perry (2006) produced a synoptic climatology from 859 NWFS events. Study evaluated different synoptic fields derived from the NCEP reanalysis dataset, and from Huntington, WV (HTS) rawinsonde data. We will compare the Sandy snowstorm to the synoptic climatology of NWFS, primarily focusing on the High Peaks (> 4kft), which is area 14 on the map.
Sandy Snowstorm Data Rapid Refresh (RAP-13km) Initialization Points D • Point A – Mount Leconte, TN (elev. 6594 feet) • Point B – Poga Mountain, NC (elev. 3773 feet) • Point C – High Knob, VA (elev. 4222 feet) • Point D – Snowshoe, WV (elev. 4711 feet) • Point E – Roan Mountain, TN (elev. 6285 feet) C B E A RAP initialization soundings were used to gather the moisture and wind data.
Sandy Snowfall Totals (cm) October 28th– 31st, 2012 • Point A – Mount Leconte, TN at elev. 6594 feet (32.7 inches) • Point B – Poga Mountain, NC at elev. 3773 feet (10.2 inches) • Point C – High Knob, VA at elev. 4222 feet (27.6 inches) • Point D – Snowshoe, WV at elev. 4711 feet (31.9 inches) • Point E – Roan Mountain, TN at elev. 6285 feet (31.5 inches) D C B E A Map courtesy of Daniel Martin, Appalachian State University
NOAA's GOES-13 satellite captured the image of the storm moving inland at 13 UTC on October 30, 2012 The satellite picture clearly shows the warm conveyor belt of moisture from the Atlantic Ocean. Relatively abundant moisture was available across the central and southern Appalachians for excessive snowfall.
Moisture Anomalies Precipitable Water (inches) The precipitable water values were well above that of typical northwest flow snowfall events.
Moist Layer Characteristics (mb) Relative Humidity values of 80% of higher Another way to depict how abnormally deep the moisture was for the Sandy snowstorm is to look at the thickness of the moist layer. The graphs above shows that the thickness of the moist layer during Sandy was much deeper than typical northwest flow snowfall events.
Moisture Anomalies 850mb Mixing Ratio Since orographic lift is generally the strongest at 850mb, high moisture values at this level is important for the development of heavy snowfall. During the Sandy snowstorm, the 850mb mixing ratio abnormally high contributing to the heavy snows and high Snow-to-liquid ratio content.
Strong Northwest flow at 850mb 11 UTC October 30th, 2012 • Strong northwest flow continued from late evening on October 29th through early October 31st. • The strong northwest flow produced persistent and strong orographic lift over the west to northwest facing slopes of the central and southern Appalachians.
850mb Wind Direction and Speed • Map Courtesy of Baker Perry, Ph.D., Assistant Professor of Geography, Appalachian State Univ. Even though the wind direction during the Sandy snowstorm was more westerly than typical northwest flow events, the much stronger 850mb jet produced strong orographic forcing over the windward slopes.
850mb Temperature (Degrees C) During the Sandy snowstorm, temperatures at 850mb were slightly warmer than typical northwest flow events which contributed to the high snow-to-liquid ratio.
Snowfall Beginning-End (Duration in hours) 20 UTC 28th October through 17 UTC 31st October, 2012 Besides the meteorological factors, an important contribution to the heavy Sandy snows was due to the duration of the event. As you can tell from the graph above, the duration of the Sandy snowstorm was abnormally long compared to a typical northwest flow event.
Composite Trajectories with Great Lakes Connection (GLC) and No GLC Courtesy of Baker Perry, Ph.D., Assistant Professor of Geography, Appalachian State Univ. Trajectory Class 2 (No GLC) Trajectory Class 3.1 and 3.2 (GLC) NWFS research has looked at the contribution of the Great Lakes Connection (GLC) to snowfall. Three backward trajectories were studied. Trajectory class 2 has no GLC, while class 3.1 and 3.2 have GLC. Research shows that GLC produces higher snowfall NWFS amounts than compared to no GLC.
HYSPLIT Backward Trajectories 21 UTC, OCT 29th, 2012 Mt. LeConte, TN Snowshoe, WV Red line ~ 850mb Blue line ~ 700mb Green line ~ 500mb
HYSPLIT Backward Trajectories 10 UTC, OCT 30th, 2012 Mt. LeConte, TN Snowshoe, WV Red line ~ 850mb Blue line ~ 700mb Green line ~ 500mb
HYSPLIT Backward Trajectories 17 UTC, OCT 31st, 2012 Mt. LeConte, TN Snowshoe, WV Red line ~ 850mb Blue line ~ 700mb Green line ~ 500mb
Study Conclusions • The backward trajectory analysis of the Sandy snowstorm showed a prolonged period of the Great Lakes Connection (GLC) across the central and southern Appalachians. • The GLC contributed to the high moisture content of the boundary layer, which enhanced both snowfall and snow-to-liquid ratio content of the snow.
Study Conclusions(cont) • The backward trajectory analysis also shows the warm conveyor belt from the circulation around Sandy at both the 700 and 500mb levels. The warm conveyor belt pulled deep moisture into the Appalachians. • The 700 and 500mb trajectories also showed at least a brief fetch over the Atlantic which is likely not typical for a NWFS event.
Study Conclusions(cont) • Moisture at all levels were much higher than typical NWFS events. The deep moisture likely contributed to the heavy snowfall amounts. • Even though the boundary layer temperatures (850mb) were warmer than normal, the deep moisture in the colder mid-levels did allow for favorable dendritic snow growth.
Study Conclusions(cont) • The overall wind direction was a little more westerly than typical NWFS events, which is usually less favorable for orographic forcing. However, the strength of the low-level jet was much stronger than normal events producing strong orographic forcing.
NWFS Aspects of Sandy • Part I: A General Overview of NWFS in the Southern Appalachians • Part II: A Unique Synoptic Setting for the Production of Northwest Flow Snow • Part III: Moisture Anomalies and Trajectory Analysis • Part IV: Radar and Satellite Observations Questions?