Download
1 / 40
400 likes | 507 Vues
Learn to organize and present data for state, regional, and district reports. Understand key features, sources, and cycles of data collection. Utilize evaluation models and various data sources for improved decision-making. Enhance visibility, inform change, and celebrate achievements through structured data organization.

E N D
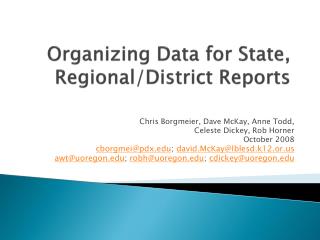
Organizing Data for State, Regional/District Reports Chris Borgmeier, Dave McKay, Anne Todd, Celeste Dickey, Rob Horner October 2008 cborgmei@pdx.edu; david.McKay@lblesd.k12.or.us awt@uoregon.edu; robh@uoregon.edu; cdickey@uoregon.edu
Objectives • Clarify evaluation questions for effective decision making around discipline and school climate • Define critical features for organizing the data • Define data sources needed • Pbseval for discipline, SIS for achievement & attendance • Define the cycles and timelines for data collection and reporting
Why to Organize & Present Data • Guide Decision Making • Plan • Progress monitor • Inform Change/Need • Visibility/Support • FUNDING • Celebrate accomplishments
What questions to consider • How many schools are adopting PBIS? • What percentage of schools in state, region/district? • SET, TIC, BoQ • How many schools are implementing SWPBIS at criteria? • SET, TIC, BoQ • Are schools implementing SWPBIS perceived as safe? • School Safety Survey • What are discipline patterns? • SWIS • What are attendance patterns? • SIS • What are achievement patterns? • SIS, State Testing scores DIBELS, AIMS Web
How to Present & Organize Data • Written Documents • Visual/Graphic Display • Easy to Read • Oral Reports/presentations • Status reports • Website • Post surveys and other resources • Schedule reminders to school to complete survey • Make fair comparisons • Account for 20% change in attendance • Calculate per 100 students • Percent of total • Account for days of week if used for report
When to Present the Data • District/ Regional Leadership Team Meetings • To guide decision making • Quarterly, annually • Monitor Progress • Annual Action Planning • School Board Meetings • State Leadership Team Meetings • State/regional conferences • Newsletters • Establish a rhythm
An Evaluation Model for School-wide PBS Designed for a school or cohort of schools
Data Sources Available • SWIS + PBS Surveys + PBS Eval
PBS Surveys • Online survey application for school teams and staff (free of charge) • www.pbssurveys.org • Complete Local Coordinator Form and submit to • PBS Applications Manager • 1235 UO • Eugene, Oregon 97403 • PBS Surveys 5 different measures for schools to use that measure the: • percent of implementation of SW-PBS • risk and safety factors • Rates of office discipline referrals • Each of the 5 measures are used at different times and for different purposes
PBS Surveys Team Implementation Checklist EBS Self-Assessment Survey School Safety Survey Benchmarks of Quality SET
PBS Eval • PBSEval™ is • a web-based progress monitoring service that permits specific district and state-level organizations such as the Licensee to monitor and review selected area-wide administrative data and generate automated reports (collectively “Data”) in a manner that does not disclose personally identifiable information • Accessing PBS Eval • License agreement • State $1000/year • District $500/year • Participate in 90 minute training
There are 1239 public schools in Oregon 284 schools 674 schools as of 10/24/08
Elementary Schools (K-6) SET’s x Year 2004-05 73 2005-06 148 2006-07 224 2007-08 249
Elementary Schools TIC’s x Year from OR MS 2004-05 27 2005-06 30 2006-07 76 2007-08 107
Middle School SET’s x Year 2004-05 16 2005-06 35 2006-07 71 2007-08 71
High School SET’s x Year 2004-05 7 2005-06 18 2006-07 21 2007-08 44
Nat’l MS Mean .97 ODR/100/ Day Nat’l Elem Mean .39 ODR/100/ Day
Outcome Data ODR Suspension/Expulsion LRE Attendance Academic Achievement School climate surveys Staff retention Implementation Data Self Assessment SET What to Present (PBS Examples)
Outcome Data Academic Achievement State Test Scores CBM/ DIBELS/ EZ CBM/ AimsWeb LRE Attendance Implementation Data PET-R Healthy Systems Checklist In Program Assessments School/ Classroom Observations What to Present (Academic Achievement Examples)
How to calculate & create graphs • Across Schools/District-wide Data • SWIS won’t do it • Capabilities of new SAMI? • PBS Surveys won’t do it • Can access all data but have to compile it your self • DIBELS Survey • PBS Eval • Other programs -- eSIS? Etc? • Need some Excel skills
PBS in TTSD Carol Sadler
T-TSD Demographics • 16 Schools, 12,000 students • 10 elementary, 1 charter, 3 middle, 2 high • Special Programs participation • 1,200 Special Education (10%) • 1,800 English Language Learners (15%) • 1,500 Talented and Gifted (12%) • Socio-economic status • Title 1 in 5 elementary schools • Free/Reduced ranges from 7% to 58%
T-TSD analyses also show… For 5th grade students who have attended T-T since kindergarten or first grade (i.e., intact groups) 94% met or exceeded OSA Reading/Literature benchmark in 2004-05
T-TSD ODR DistributionAll Schools 2004-05… 1% received 6 or more referrals ~5% 8% received 2-5 referrals ~15% 80% received NO referrals; 90% received 0-1 referrals ~80% of Students (Walker, et al. 1996)
Another example • Dave McKay and Scott Perry