Download
1 / 35
350 likes | 511 Vues
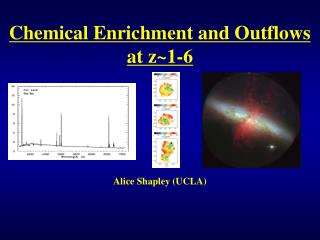
Chemical Enrichment and Outflows at z~1-6. Alice Shapley (UCLA). Outline. Evolution in chemical enrichment patterns out to z~6. Metal content of star-forming galaxies. Holy Grail: “Direct” abundance determinations. Abundance gradients.

E N D
Chemical Enrichment and Outflows at z~1-6 Alice Shapley (UCLA)
Outline • Evolution in chemical enrichment patterns out to z~6. • Metal content of star-forming galaxies. • Holy Grail: “Direct” abundance determinations. • Abundance gradients. • Physical extent of galaxy-scale outflows at high redshift: emission-line probes.
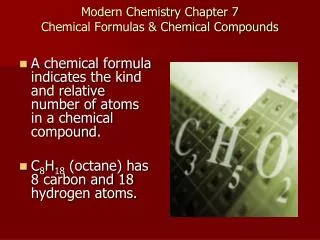
Galaxy Metallicities • Fundamental metric of galaxy formation process, reflects gas reprocessed by stars, metals returned to the ISM by SNe explosions. • Measured from HII regions and stars in star-forming galaxies, stars in early-types. • Metallicity Gas phase oxygen abundance in star-forming galaxies. • Metal production rate reflects rate of high-mass star formation. Chemical enrichment history entwined with build-up of stellar mass. (Bouwens et al. 2010) (Marchesini et al. 2009)
Galaxy Metallicities • Galaxies display universal correlations among Luminosity (L), Stellar mass (M), and metallicity (Z). • Recently formulated as a relation among M, Z, and SFR (Mannucci et al. 2010). • Departures from closed-box expectations can reveal evidence for outflow/inflow. • Closed box: • Z = y × ln (1/m) • (Z=metallicity, y=yield, m=gas fraction=Mgas/(Mgas+M*)) • Most comprehensive M-Z dataset: SDSS (Tremonti et al. 2004), 53,000 galaxies. May suggest importance of feedback in low-mass galaxies. Ongoing challenge: M-Z evolution. (Tremonti et al. 2004)
Extragalactic Emission lines: Ensembles of HII regions • For galaxies at large distances, we obtain integrated rest-frame optical emission-line spectra. Represent averages of ensemble of HII regions. (Yang & Hester, HST/WFPC2) z~2 3” diameter ~ 6 kpc at z=0.1 (Tremonti et al. 2004) (Erb et al. 2003)
Rest-frame Optical Spectra • Emission-line set: [OII], Hb [OIII], H, [NII], [SII] • Ratios of emission lines used to infer a wide range of physical conditions: • Metallicity (oxygen) {R23, N2, O3N2, others} • Electron density {[OII] and [SII] doublet ratios} • Ionization parameter {[OIII]/[OII]} • Electron temperature {[OIII] ratios} • Dust extinction {Balmer line ratios} (Kennicutt 1998)
Rest-frame Optical Spectra • Emission-line set: [OII], Hb [OIII], H, [NII], [SII] • Ratios of emission lines used to infer a wide range of physical conditions: • Metallicity (oxygen) {R23, N2, O3N2, others} • Electron density {[OII] and [SII] doublet ratios} • Ionization parameter {[OIII]/[OII]} • Electron temperature {[OIII] ratios} • Dust extinction {Balmer line ratios} Hb [OIII] [OII] (Kennicutt 1998)
Rest-frame Optical Spectra • Emission-line set: [OII], Hb [OIII], H, [NII], [SII] • Ratios of emission lines used to infer a wide range of physical conditions: • Metallicity (oxygen) {R23, N2, O3N2, others} • Electron density {[OII] and [SII] doublet ratios} • Ionization parameter {[OIII]/[OII]} • Electron temperature {[OIII] ratios} • Dust extinction {Balmer line ratios} Ha+[NII] (Kennicutt 1998)
Rest-frame Optical Spectra • Emission-line set: [OII], Hb [OIII], H, [NII], [SII] • Ratios of emission lines used to infer a wide range of physical conditions: • Metallicity (oxygen) {R23, N2, O3N2, others} • Electron density {[OII] and [SII] doublet ratios} • Ionization parameter {[OIII]/[OII]} • Electron temperature {[OIII] ratios} • Dust extinction {Balmer line ratios} Ha+[NII] Hb [OIII] [OII] (Kennicutt 1998)
Rest-frame Optical Spectra • Emission-line set: [OII], Hb [OIII], H, [NII], [SII] • Ratios of emission lines used to infer a wide range of physical conditions: • Metallicity (oxygen) {R23, N2, O3N2, others} • Electron density {[OII] and [SII] doublet ratios} • Ionization parameter {[OIII]/[OII]} • Electron temperature {[OIII] ratios} • Dust extinction {Balmer line ratios} [SII] [OII] (Kennicutt 1998)
Rest-frame Optical Spectra • Emission-line set: [OII], Hb [OIII], H, [NII], [SII] • Ratios of emission lines used to infer a wide range of physical conditions: • Metallicity (oxygen) {R23, N2, O3N2, others} • Electron density {[OII] and [SII] doublet ratios} • Ionization parameter {[OIII]/[OII]} • Electron temperature {[OIII] ratios} • Dust extinction {Balmer line ratios} [OIII] [OII] (Kennicutt 1998)
Rest-frame Optical Spectra • Emission-line set: [OII], Hb [OIII], H, [NII], [SII] • Ratios of emission lines used to infer a wide range of physical conditions: • Metallicity (oxygen) {R23, N2, O3N2, others} • Electron density {[OII] and [SII] doublet ratios} • Ionization parameter {[OIII]/[OII]} • Electron temperature {[OIII] ratios} • Dust extinction {Balmer line ratios} [OIII] [OIII] (Kennicutt 1998)
Rest-frame Optical Spectra • Emission-line set: [OII], Hb [OIII], H, [NII], [SII] • Ratios of emission lines used to infer a wide range of physical conditions: • Metallicity (oxygen) {R23, N2, O3N2, others} • Electron density {[OII] and [SII] doublet ratios} • Ionization parameter {[OIII]/[OII]} • Electron temperature {[OIII] ratios} • Dust extinction {Balmer line ratios} Hg Hb Ha (Kennicutt 1998)
Rest-frame Optical Spectra • Emission-line set: [OII], Hb [OIII], H, [NII], [SII] • Ratios of emission lines used to infer a wide range of physical conditions: • Metallicity (oxygen) {R23, N2, O3N2, others} • Electron density {[OII] and [SII] doublet ratios} • Ionization parameter {[OIII]/[OII]} • Electron temperature {[OIII] ratios} • Dust extinction {Balmer line ratios} Ha+[NII] Hb [OIII] [SII] [OII] (Kennicutt 1998)
Rest-frame Optical Spectra • Emission-line set: [OII], Hb [OIII], H, [NII], [SII] • Ratios of emission lines used to infer a wide range of physical conditions: • Metallicity (oxygen) {R23, N2, O3N2, others} • Electron density {[OII] and [SII] doublet ratios} • Ionization parameter {[OIII]/[OII]} • Electron temperature {[OIII] ratios} • Dust extinction {Balmer line ratios} Ha+[NII] Hb [OIII] [SII] [OII] (Kennicutt 1998)
Rest-frame Optical Spectra • Emission-line set: [OII], Hb [OIII], H, [NII], [SII] • At low-redshift, these emission lines form the basis of traditional optical spectroscopy. • At z > 1.4, [OII] moves past 9000Å. Becomes a near-IR problem. • Thus far, for most z>1 studies, by necessity, only subsets of rest-frame optical lines used to infer metallicites (N2:[NII]/Ha; R23: ([OIII]+[OII])/Ha; O3N2: ([OIII]/Hb)/([NII]/Ha) ). Different subsets at different redshifts. Ha+[NII] Hb [OIII] [SII] [OII] (Kennicutt 1998)
A Truly Scary Plot • Different calibrations for the same 27000 SDSS DR4 emission-line galaxies. • Choice of calibration has significant effect on slope, y-intercept, turnover of M-Z relation!!! • Relative metallicities better-constrained than absolute metallicities. (Kewley & Ellison 2008)
High-redshift results: M-Z at z~2 (Erb, Shapley et al. 2006a) • Keck/NIRSPEC results (Erb et al. 2006a,b,c). • Sample of 87 star-forming galaxies at z~2 with both M* and [NII]/Ha (gas phase O/H) measurements; divide into 6 bins of M* .Composite spectra. • Clear increase in [NII]/Ha with increasing M* M-Z at z~2!! Evolution wrt z~0. • Estimate gas fractions from H SFR, determine how Z changes with m. • Shallow increase in Z with decrease of gas fraction, suggestive of outflows?
High-redshift results: M-Z at z~3 (Maiolino et al. 2008) • VLT/SINFONI results (Maiolino et al. 2008; Mannucci et al. 2009). 16 galaxies (comparable samples from Forster Schreiber et al. 2009 [SINFONI] and Pettini et al. 2001 [NIRSPEC]). • Apparent evolution in M-Z relation from z~2-3. Lower Z at fixed M*. Accelerated evolution? Differential evolution? Sample is too small to tell. • Different sets of lines at each redshift. Highest-redshift measurement: z=3.79.
Ground-based Limitations • Atmospheric absorption limits the accessible redshift ranges for various rest-frame optical features. • z~2 is great for getting [OII], [OIII]+Hb, Ha+[NII]+[SII] simultaneously. • z~1.8 and z~2.8. OUT OF LUCK! • [OII] is the only strong line accessible beyond z~3.7. For z>4, like UV community studying low-z DLAs and/or OVI absorbers: NEED SPACE.
Ground-based Limitations • Significant fraction of JHK bands is affected by strong sky emission lines, leading to severe systematics at affected wavelengths. Beyond l~2.35 mm, thermal background becomes very high. • With Keck/NIRSPEC (R~1500), ~1/3 of each bandpass (JHK) is affected by strong sky-lines. With better resolution, less of an effect. • In practice: very difficult to find redshifts at which multiple lines are free of sky contamination. Keck/NIRSPEC H-band Sky Spectrum (Yuck!)
JWST/NIRSPEC and Metallicities • Beyond z~4, there are no emission-line-based measurements of chemical enrichment in star-forming galaxies. • Between z~1 and z~4, there are several significant gaps in redshift coverage (z~1.7-2.0, 2.6-3.0) of emission-line metallicities in star-forming galaxies. Plus, the existing samples of objects with individual metallicity measurements are small. • Goal: trace continuous history of metal enrichment and M-Z relationship up to the reionization epoch, to go along with evolution of SFR and stellar mass densities, and IGM chemical enrichment. • Goal: at z~6, estimate ionizing photon production rate for a given non-ionizing UV luminosity. Ionizing photon production per mass of stars formed depends on Z.
Evolution of Galaxies at z>4 • Evolution in the characteristic luminosity (M*) from z~8 to z~4 (900 Myr) by ~1 magnitude (Bouwens et al. 2011). • Evolution in the SFR and stellar mass density at z>4, Lya fraction (Bouwens et al. 2010; Stark et al. 2007, 2010; Gonzalez et al. 2010). (Bouwens et al. 2010, 2011; Gonzalez et al. 2010)
Evolution of IGM Metal Content • Evolution of CIV density suggests decline in C abundance and in CIV/C ratio (ionization effects) beyond z~4. • It is critical to probe the metal content of galaxies over this same redshift range. • In particular, probe galaxies in the vicinity of QSO sightlines, connecting ISM enrichment with IGM enrichment. (Simcoe et al. 2011; Magellan/FIRE, 13 sightlines)
JWST/NIRSPEC and Metallicities • Measuring metallicity at z≥3 using NIRSpec/MSA/slit, R~1000: • Based on detections of weakest lines (e.g. [NII]). • Require interesting dynamic range in weak/strong (i.e. [NII]/Ha) ratio, ~×10. • At z~6 [5,4,3], with texp~104 s, detect [NII]/Ha ratios of 1/10 for galaxies with SFR~10 [7,5, 3] M/yr (assuming standard conversion between Ha and SFR). (Adapted from NIRSpec sensitivity plots, JWST site)
JWST/NIRSPEC and Metallicities • Measuring metallicity at z≥3 using NIRSpec/MSA/slit, R~1000: • Detect all “strong lines” ([OII] – [SII]), akin to SDSS spectra. • z~3 requires Band I + Band II. • z~4-6 require Band II + Band III. • Surface density of such objects from z~3-6 <5-10 arcmin-2. • Well-matched to NIRSpec/MSA mode. (Adapted from NIRSpec sensitivity plots, JWST site)
Z=1/25 Zsun Holy Grail: Direct Abundances (Van Zee 2000) • Use [OIII] 4363/(5007,4959) to get Te, [SII] to get ne • Problem: [OIII]l4363 weak, even in local low-Z gals; star-forming galaxies studied to date are not typically very metal-poor. Works best at low-Z. • Caveat: Temperature fluctuations.
Holy Grail: Direct Abundances • Difficult to measure [OIII]l4363 at low redshift. • There is literally one [OIII]l4363 measurement at z>1 (Yuan & Kewley 2009)!!! And this is a lensed galaxy at z=1.7, magnified by ×15. In this object, [OIII] l4363/[OIII]l5007~1/25, Z<0.1Z. • It is critical for us to place our indirect metallicity measurements on more robust footing, even if only for low-metallicity systems. (Yuan & Kewley 2009)
JWST/NIRSPEC and Direct Abundances • Measuring [OIII]l4363 at z>1 using NIRSpec/MSA/slit, R~1000: • Assume 4363/5007 ratio ~1/30 (fair for ~0.1-0.3 Z galaxies). • Detect [OIII]l4363 at z~2[3,4,5,6] in such galaxies with SFR~5 [15,10,20,30] M/yr. ([OIII]l4363 shifts from Band I to Band II between z~4 and 5). • Only possible with JWST. (Adapted from NIRSpec sensitivity plots, JWST site)
JWST/NIRSPEC and Direct Abundances • Why might this work? • Bouwens et al. (2009) show that rest-frame UV slopes get bluer at fainter rest-UV luminosities at fixed redshift, and at higher redshifts at fixed rest-UV luminosity. • Less dust, lower metallicity? • While Population III at z>6 may await confirmation (see talk by Richard Ellis, Dunlop et al. 2011), slopes are definitely bluer at z>4 than at z~2. (Bouwens et al. 2009)
Abundance Gradients • Near-IR IFU spectrographs have been used to measure the radial gradient in chemical enrichment within a small sample of individual systems at z~2-3. • Two lensed systems (Clone at z~2: Jones et al. 2010; Sp1149 at z~1.5: Yuan et al. 2011). • Both measured with Keck/OSIRIS+AO. Metallicities estimated with ratio of strong lines ([NII]/Ha). Source-plane resolution~200-300 pc. • Steep gradients compared with local spirals and ellipticals. • Supports picture of “inside-out” formation. Bulge first, followed by slower build-up of the disk.
Abundance Gradients • Near-IR IFU spectrographs have been used to measure the radial gradient in chemical enrichment within a small sample of individual systems at z~2-3. • Inverted abundance gradients have been measured in 3 systems z~3 using VLT/SINFONI in seeing-limited mode (0.5” resolution 4 kpc). Use combinations of [OIII]/Hb, [OIII]/[OII], [NeIII]/[OII] for metallicity estimate. Smaller in the center! • Used as evidence for infall of metal-poor gas fueling star formation (cold gas accretion!). • What’s going on?
JWST/NIRSPEC and Abundance Gradients • Measuring spatially-resolved strong-line ratios in star-forming galaxies at z~2-3 using NIRSpec/IFU, with kpc-scale resolution. • 3”×3” FOV well-matched to studying spatially-resolved galaxy properties at these redshifts (25 kpc×25 kpc). • Possible from the ground using AO, but require tip-tilt star, PSF more stable in space. • Measure for objects at z>3.7 as well (not possible from the ground). (From NIRSpec pages, JWST site)
Summary • JWST/NIRSpec will enable key measurements of the chemical enrichment content of galaxies continuously across cosmic time from z~1-6 (and beyond). Without JWST, emission-line metallicity measurements are simply not possible at z>3.7 (and in other key redshift ranges). • With JWST/NIRSpec we will probe the build-up of heavy elements in galaxies up to and including the epoch of reionization. We will be able to attempt risky measurements such as the “direct” or “Te” method for estimating metallicities, as well as spatially-resolved abundance gradients, which are currently a matter of controversy. • These measurements provide a fundamental and complementary approach for studying the evolution of the galaxy population, as opposed to simply charting the SF-history and the build-up of stellar mass. In particular, the important epoch beyond z>3.7 belongs to JWST alone.