Download
1 / 8
80 likes | 296 Vues
Rocky Mountain Power - Utah. Workgroups I and II Load Research and Peak-Hour Forecasting. Presented by UTAH INDUSTRIAL ENERGY CONSUMERS Salt Lake City, Utah August 12, 2010. How the Rocky Mountain Power Residential Sample Size is Calculated.

E N D
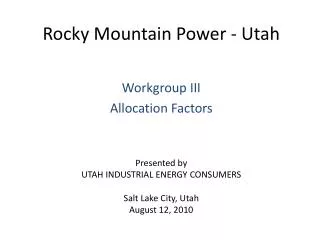
Rocky Mountain Power - Utah Workgroups I and II Load Research and Peak-Hour Forecasting Presented by UTAH INDUSTRIAL ENERGY CONSUMERS Salt Lake City, Utah August 12, 2010
How the Rocky Mountain Power Residential Sample Size is Calculated • RMP states that its goal is to provide precision of +/- 5% with 90% confidence for an estimate of the average of the twelve monthly system peak hours--using monthly kWs at time of system peak. The recorders were stratified by average annual kWh usage as follows: 0-750, 751-1500, and over 1500 monthly kWh. • The average of the average kW is calculated for each stratum, yielding 3 averages. These averages are weighted by number of customers in each stratum to obtain one overall average. The average and the standard deviations from the strata are then used to arrive at the total sample size. • But, the 5% precision with 90% confidence criteria apply to only one number: the overall average kW across all months and customers. It does not to apply to any monthly figures. Utah Industrial Energy Consumers
Actual Precision and Confidence Attained for Monthly Estimate Using RMP Sample Are Lower than Criteria • To achieve the 5% precision and 90% confidence criteria at the monthly level, RMP would need larger sample sizes than that it has calculated using the 12-month average kW at system peak. • This means, with the sample size as calculated by RMP, lower precision is attained than the 5% claimed. • The table below indicates the precisions actually attained each month using the current sample of 144 customers. Utah Industrial Energy Consumers
Rocky Mountain Power - Utah The division also questions the accuracy of RMP’s Load Research Data “Q. What is your opinion of the company’s load research program? A. The Company purports to be designing its load samples for the non-demand metered classes to meet a PURPA standard, discussed in Mr. Thornton's testimony, which mandates that samples be designed so that 90 percent of population load estimates are within 10 percent of actual loads. While the company may be designing samples in an appropriate way to meet this standard, the resulting estimates from their samples of over the last several rate cases and this case do not appear to be meeting the standard. ” Direct Testimony of Jonathan Nunes Docket No. 09-035-23 DPU Exhibit 9.0, Page 13 October 8, 2009 Utah Industrial Energy Consumers
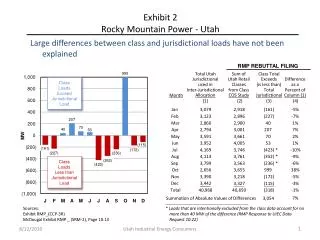
Rocky Mountain Power - Utah Large differences between class and jurisdictional loads have not been explained RMP REBUTTAL FILING Total UtahJurisdictionalused inInter-JurisdictionalAllocation Sum ofUtah RetailClassesfrom Class COS Study Class TotalExceeds(is less than)TotalJurisdictional Class Loads Exceed Jurisdictional Load Differenceas aPercent ofColumn (1) Month (1) (2) (3) (4) 2,918 (161) -5% 2,896 (227) -7% Jan 3,079 2,900 40 1% Feb 3,123 3,001 207 7% Mar 2,860 3,661 70 2% Apr 2,794 4,005 53 1% May 3,591 3,746 (423) * -10% Jun 3,952 Class Loads Less than Jurisdictional Load 3,761 (352) * -9% Jul 4,169 3,563 (236) * -6% Aug 4,113 3,655 999 38% Sep 3,799 3,218 (172) -5% Oct 2,656 3,327 (115) -3% Nov 3,390 40,650 (318) -1% Dec 3,442 7% Summation of Absolute Values of Differences 3,054 Total 40,968 * Loads that are intentionally excluded from the class data account for no more than 40 MW of the difference (RMP Response to UIEC Data Request 10.22) Sources: Exhibit RMP_(CCP-3R) McDougal Exhibit RMP _ (SRM-2), Page 10.13 Utah Industrial Energy Consumers
Rocky Mountain Power - Utah Another issue with the load data is that it is not adjusted to reflect typical “peak-making” weather “Q. Is all of the load data for each rate schedule that is used to calculate demand related cost allocation factors in the class cost of service study in this case weather normalized? If not, please explain why not. A. Customer class load data used in the cost of service study in this docket is based on the same methodology employed in Docket 08-035-38. In that case, the Company’s response to UIEC Data Request 1 1.6 provided the following explanation regarding rate schedule load data: ‘Customer class load data used to calculate demand-related cost allocation factors employed in the class costs of service study is not weather normalized. However, this same customer class load data is calculated from forecasted energy data which is weather normalized according to the new methodology. A description of the differences between the new and previous methodologies is provided in the Company’s response to UIEC Data Request 10.2. ‘ ”(Emphasis added) 09-035-23/Rocky Mountain Power July 29, 2009 UIEC Data Request 2.15 Utah Industrial Energy Consumers
Rocky Mountain Power - Utah Another problem with the class load data is that loads are adjusted using annual average loss factors This causes loads at peak times to be understated because the losses are higher when the temperature is hot and the loads are larger. Because of the physics of electrical systems the difference between peak losses and average losses is greater for low voltage customers than for transmission customers. As a result the low voltage customer’s loads are understated relative to transmission customer loads, causing too much cost to be allocated to transmission customers. Utah Industrial Energy Consumers
Rocky Mountain Power - Utah Conclusion Concerning Loads The sum of class loads must be reconciled to the separately determined jurisdictional loads and adjustments (calibration) should be made if differences are large. Expected sources of difference for sample classes: • Sample Accuracy • Lack of reflection of “Peak-Making” Weather • Unrecognized difference in peak losses that results in understatement of loads of low voltage customers Utah Industrial Energy Consumers