Download
1 / 35
350 likes | 376 Vues
Explore the importance of going beyond GDP in measuring poverty and well-being in Europe, as well as key initiatives and challenges in this area. Learn about the European platform against poverty and vulnerable groups in the population.

E N D
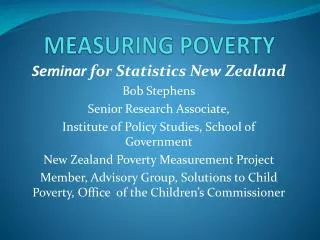
Going Beyond GDP and Measuring Poverty Inna Šteinbuka Director, Social and Information Society Statistics Eurostat
Outlines • Why going beyond GDP? • Key international and European initiatives in measuring well-being and sustainable development • European platform against poverty in the EU 2020 strategy • Vulnerable groups of European population • Measuring poverty and inequalities • Multidimensional measuring of quality of life: statistical challenges Summer Course, St Sebastian 5 July 2010
Source: Eurostat, EU-SILC and Eurofound, EQLS 2007 Note: For readability, some country's labels have been slightly repositioned Summer Course, St Sebastian 5 July 2010
Going Beyond GDP: Recent initiatives • Renewed EU Sustainable Development strategy in 2006 • OECD global project on measuring societies(Istanbul declaration in June 2007) • EU: Beyond GDP conference in Nov 2007; « GDP and Beyond » communication in Sept 2009 • Commission on the measurement of economic performance and social progress(« Stiglitz-Sen-Fitoussi » report in Sept 2009) • Europe 2020 strategy (First half 2010) Summer Course, St Sebastian 5 July 2010
Sustainable Development is an Overarching Objective of the European Union Stiglitz recommendations GDP/beyond EU 2020 Summer Course, St Sebastian 5 July 2010
The EU 2020 strategy - what is it about? • Successor of the current Lisbon strategy • ‘where the European Union should be in 2020’? • An economy based on smart, sustainable (green) and inclusive growth smart = economy based on knowledge and innovation sustainable = promoting a resource efficient, green and competitive economy inclusive = fostering high employment & social cohesion Summer Course, St Sebastian 5 July 2010
The EU 2020 strategy: key initiatives • The Commission is proposing 7 flagship initiatives:1. Innovation Union2. Youth on the move3. A digital agenda for Europe4. Resource efficient Europe5. An industrial policy for the globalisation era6. An agenda for new skills and jobs7. European platform against poverty • EU strategy sets measurable targets to be achieved by the EU by 2020. The EU targets should be translated into national targets and trajectories Summer Course, St Sebastian 5 July 2010
The EU 2020 strategy - common targets for 2020 • 75% of the population aged 20-64 should be employed • 3% of EU’s GDP should be invested in R&D • The ‘20/20/20’ climate / energy targets should be met • The share of early school leavers should be under 10% and at least 40% of the younger generation should have a tertiary degree • 20 millionless people should be at risk of poverty Summer Course, St Sebastian 5 July 2010
Vulnerable groups of population • The Council adopted (17/6/2010) the target of reducing by 20 million the number of persons at risk of poverty or social exclusion • At risk of poverty • 16 % of the EU population • Materially deprived • 8 % of the EU population • Being in a household with low work intensity: • 9 % of the EU population • NB: there are large overlaps between the three dimensions • Overall, it concerns 120 millions Europeans Summer Course, St Sebastian 5 July 2010
At risk of poverty, in % of the population Summer Course, St Sebastian 5 July 2010
Increasing effect Summer Course, St Sebastian 5 July 2010
More risk Less risk Summer Course, St Sebastian 5 July 2010
Material deprivation • Those who experience at least 4 out of 9 deprivations: people cannot afford i) to pay their rent or utility bills, ii) to keep their home adequately warm, iii) to face unexpected expenses, iv) to eat meat, fish, or a protein equivalent every second day, v) a week of holiday away from home once a year, vi) a car, vii) a washing machine, viii) a colour tv, or ix) a telephone. Summer Course, St Sebastian 5 July 2010
Source: Eurostat, EU-SILC Note: For readability, some country's labels have been slightly repositioned Enforced lack of 3 items or more Summer Course, St Sebastian 5 July 2010
Low work intensity (LWI) • Those living in households exploiting ¼ or less of their working capacities Summer Course, St Sebastian 5 July 2010
80 million at-risk-of poverty 40 million materially deprived 47 11 19 61 18 22 120 million in vulnerable groups 8 3 14 19 For EU 27 43 million in low work intensity Summer Course, St Sebastian 5 July 2010
16 % at-risk-of poverty 8 % materially deprived 10 % 2 % 4 % 25 % in vulnerable groups 2 % 1 % 3 % 4 % For EU 27 9 % in low work intensity Summer Course, St Sebastian 5 July 2010
16 % at-risk-of poverty 8 % materially deprived 10 % 2 % 4 % 25 % in vulnerable groups 2 % 1 % 3 % 4 % For EU 27 9 % in low work intensity Summer Course, St Sebastian 5 July 2010
33 % materially deprived 24% at-risk-of poverty 8 % 12 % 17 % 45 % in vulnerable groups 3 % 1 % 1 % 3 % For RO 8 % in low work intensity Summer Course, St Sebastian 5 July 2010
16 % at-risk-of poverty 8 % materially deprived 10 % 2 % 4 % 25 % in vulnerable groups 2 % 1 % 3 % For EU 27 4 % 33 % materially deprived 24% at-risk-of poverty 9 % in low work intensity 8 % 12 % 17 % 45 % in vulnerable groups 3 % 1 % 1 % 3 % For RO 8 % in low work intensity Summer Course, St Sebastian 5 July 2010
10 % at-risk-of poverty 2 % materially deprived 7 % <1 <1 % <1 % <1 % 15% in vulnerable groups 2 % 4 % For NL 7 % in low work intensity Summer Course, St Sebastian 5 July 2010
10 % at-risk-of poverty 2 % materially deprived 7 % <1 <1 % <1 % 15% in vulnerable groups <1 % 2 % 4 % For NL 7 % in low work intensity 16 % at-risk-of poverty 8 % materially deprived 10 % 2 % 4 % 25 % in vulnerable groups 2 % 1 % 3 % For EU 27 4 % 33 % materially deprived 24% at-risk-of poverty 9 % in low work intensity 8 % 12 % 17 % 45 % in vulnerable groups 3 % 1 % 1 % 3 % For RO 8 % in low work intensity Summer Course, St Sebastian 5 July 2010
17 % at-risk-of poverty 4 % materially deprived 11% 4 % 1 % 27 % in vulnerable groups 1 % 1 % 3 % 7 % For UK 14 % in low work intensity Summer Course, St Sebastian 5 July 2010
16 % AROP 8 % MD 10 % AROP 2 % MD 7 % 10 % 2 % 4 % <1 <1 % 25 % in vulnerable groups <1 % 15% in vulnerable groups <1 % 2 % 1 % 2 % 3 % 4 % 4 % 7 % LWI 9 % LWI EU 27 NL UK RO 24% AROP 17 % AROP 33 % MD 4 % MD 8 % 12 % 17 % 11% 4 % 1 % 45 % in vulnerable groups 27 % in vulnerable groups 1 % 1 % 3 % 3 % 1 % 1 % 7 % 14 % LWI 3 % 8 % LWI Summer Course, St Sebastian 5 July 2010
Eurostat-INSEE Project on Measuring Progress, Wellbeing and Sustainable Development Focus: building strategic consensus on measuring sustainability among producers of statistics Scope: 1. Households perspective and distributional aspects of income, consumption and wealth. Measuring inequalities 2. Environmental sustainability • Multidimensional measures of quality of life Summer Course, St Sebastian 5 July 2010
Households Perspective and Distributional Aspects of Income, Consumption and wealth • Promoting already existing information on NA • Using the household survey to provide macro-economic information on the distribution of income, consumption and wealth • Fostering the compilation of the balance sheets accounts of households • Broaden income measures to non market domestioc activities Summer Course, St Sebastian 5 July 2010
Environmental Sustainability • Revising sustainable development scoreboard with focus on the indicators of environment sustainability • Complementing NA with integrated environmental economic accounts • Linking NA and energy accounts Summer Course, St Sebastian 5 July 2010
Quality of Life – What Should be Measured? Multidimensional definition of quality of life • Material living standards (income, consumption and wealth) • health, • education, • personal activities (paid work, unpaid domestic work, commuting, leisure, housing), • political voice and governance, • social connections, • environmental conditions, • personal insecurity, • economic insecurity. Summer Course, St Sebastian 5 July 2010
Europe 2020 Poverty and social inclusion At risk of poverty Material deprivation Low work intensity HH Education Early school leavers Tertiary attainment Labour Market Employment rates Stiglitz Commission Recommendations Qol GDP & Beyond QoL & Well being Social indicators Distributions and inequalities Summer Course, St Sebastian 5 July 2010
Quality of Life: Statistical Challenges • Establishing objective indicators of quality of life on the basis oh household surveys and relevant administrative sources • Assessing the life inequalities • Aggregating the different inequality dimensions (composite indicators) • Measuring subjective well-being Summer Course, St Sebastian 5 July 2010
Thank you for attention Summer Course, St Sebastian 5 July 2010 --